Spectral flow cytometry
Cytometry Single-cellhttps://www.nature.com/articles/s41592-023-02042-3
Spectral flow cytometry is an advanced technique used to analyze the physical and chemical characteristics of cells or particles as they flow in a fluid stream through multiple laser beams. This method captures the entire emission spectrum of fluorescent labeled antibodies, allowing for the simultaneous measurement of numerous parameters on individual cells, including viability and the presence of specific cell surface or intracellular markers. With the capability to distinguish up to 40 or more parameters, spectral flow cytometry significantly enhances the resolution of cellular analysis.
Production systems
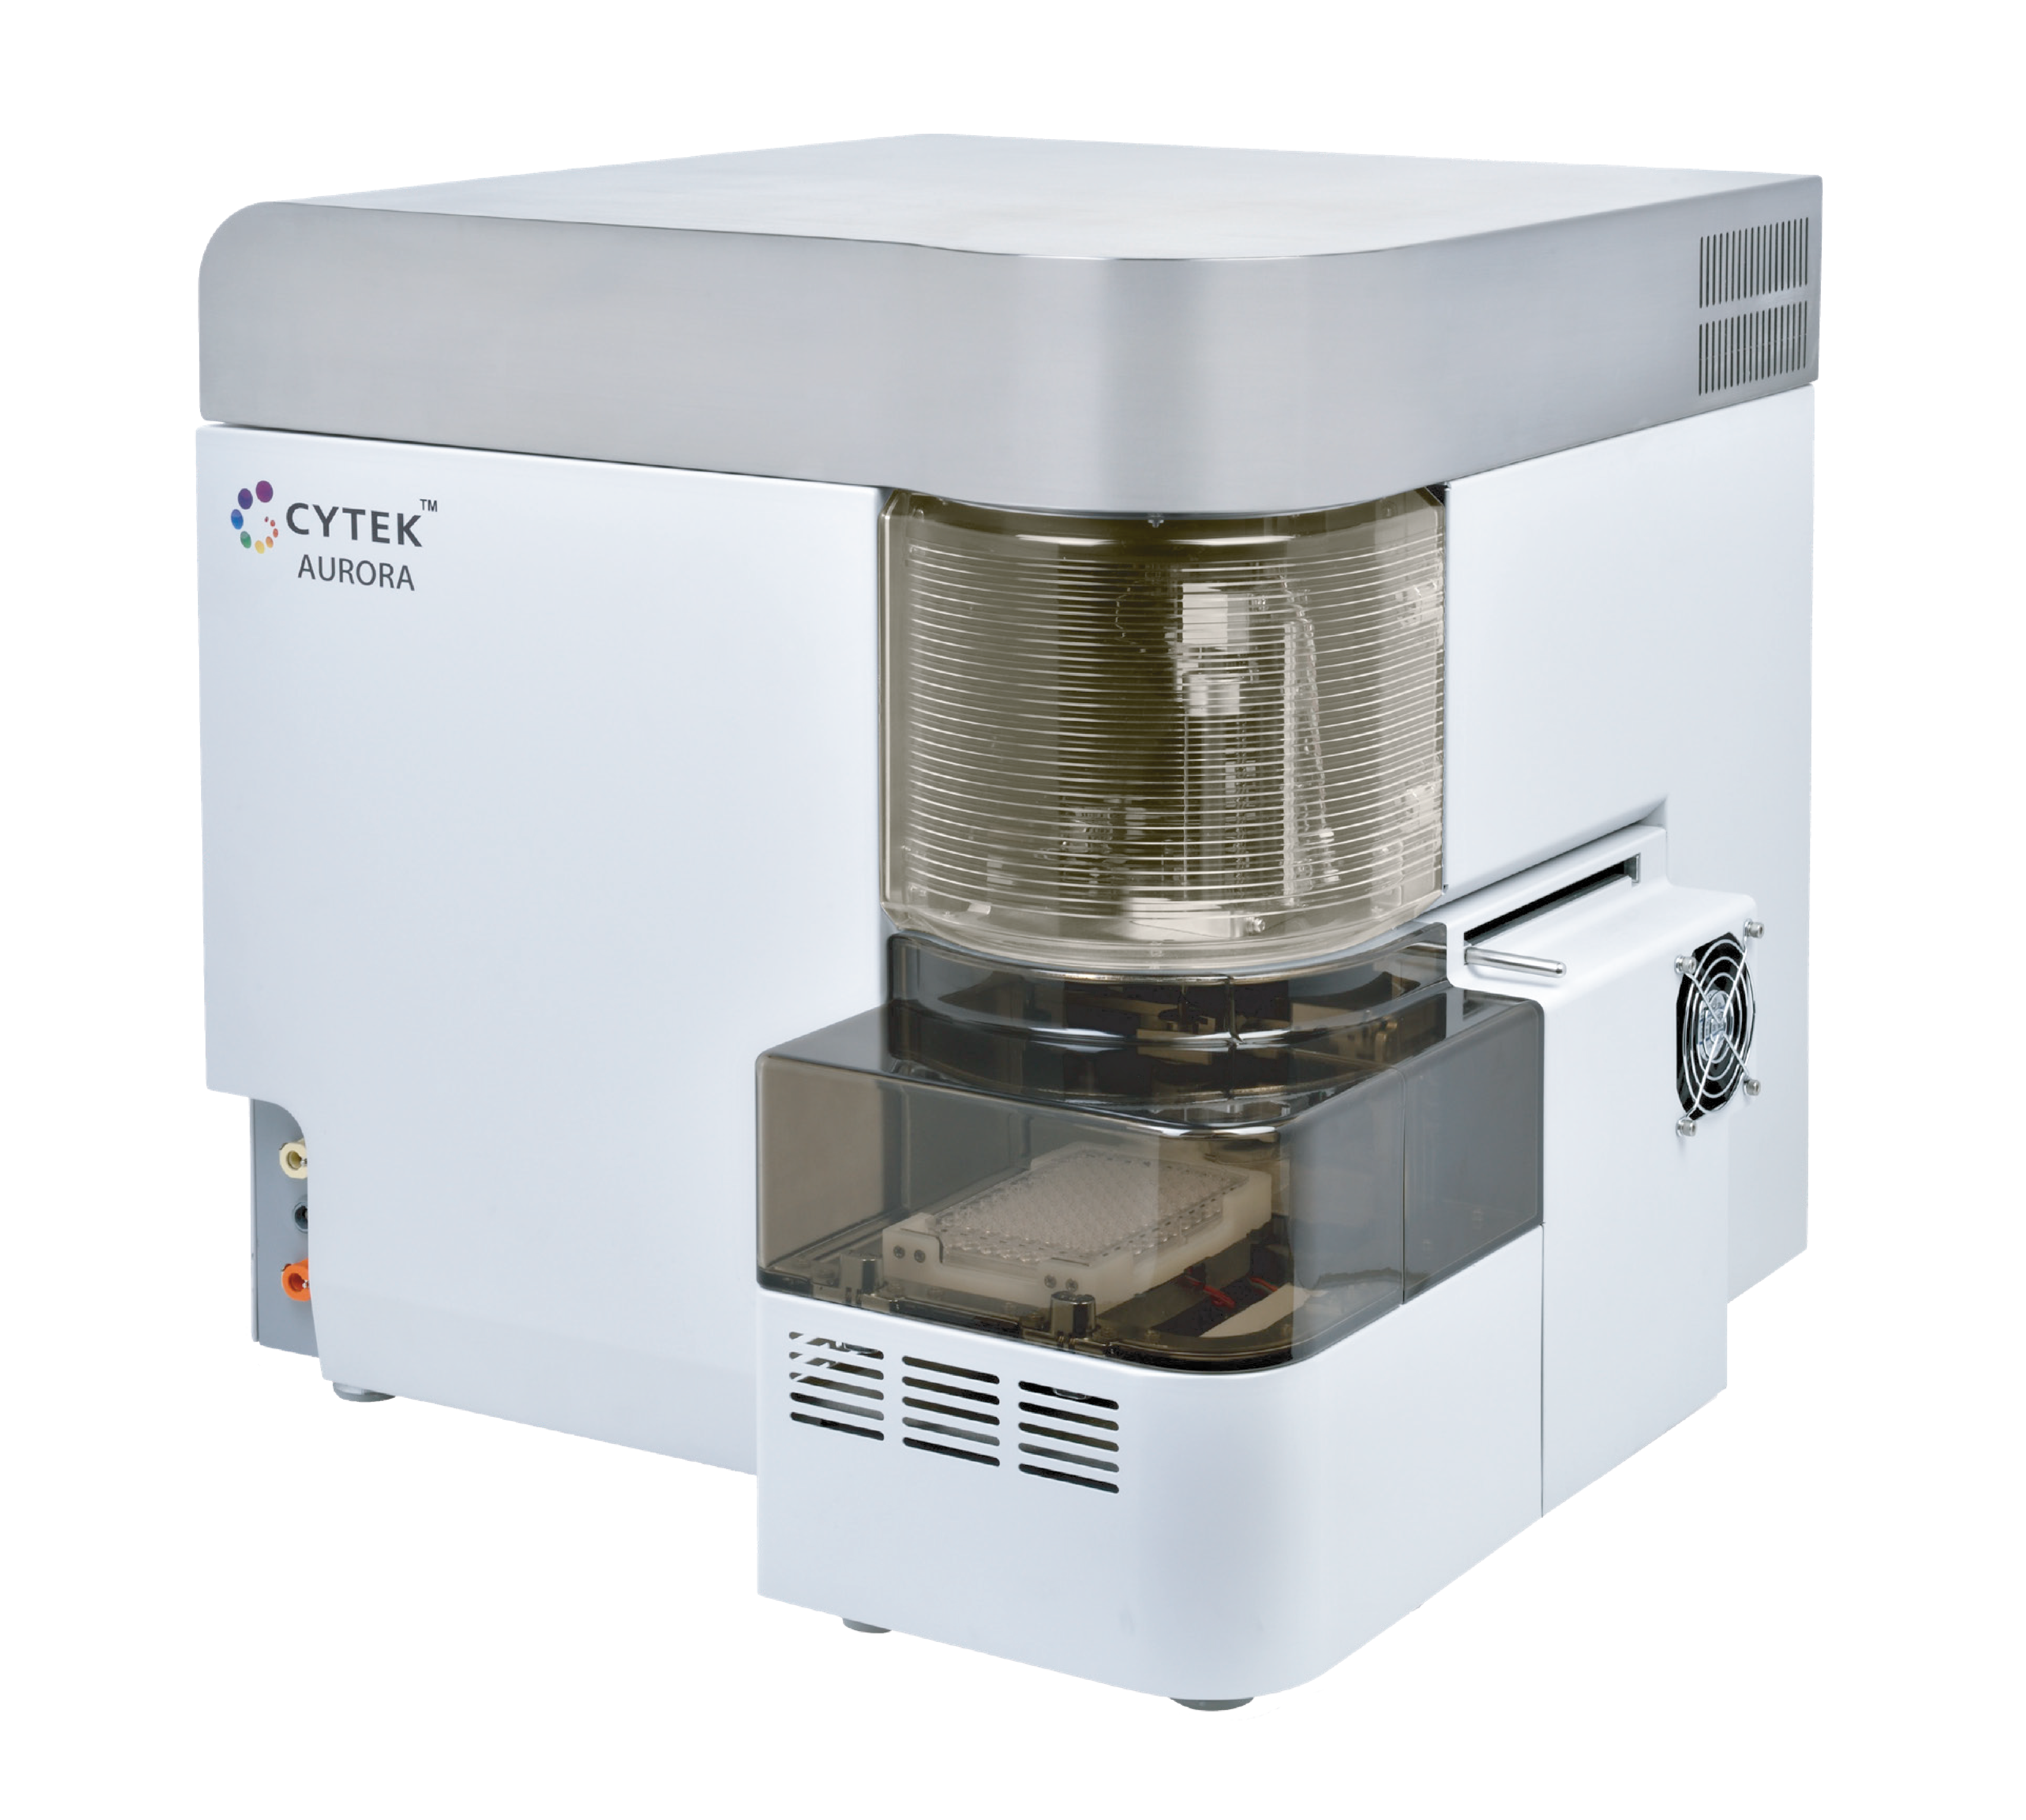
Cytek Aurora
The Cytek® Aurora is a cutting-edge spectral flow cytometer that enhances traditional flow cytometry capabilities. It employs full spectrum flow cytometry technology to measure the complete emission spectra of fluorescent dyes excited by multiple lasers. This allows the Aurora to differentiate between fluorochromes with highly overlapping emission spectra. With up to 5 lasers and 64 fluorescent detectors, the Aurora can run complex multicolor experiments, enabling the analysis of up to 40 parameters in a single sample.
See more about the technologyAssociated pipelines
high-dimensional cytometry
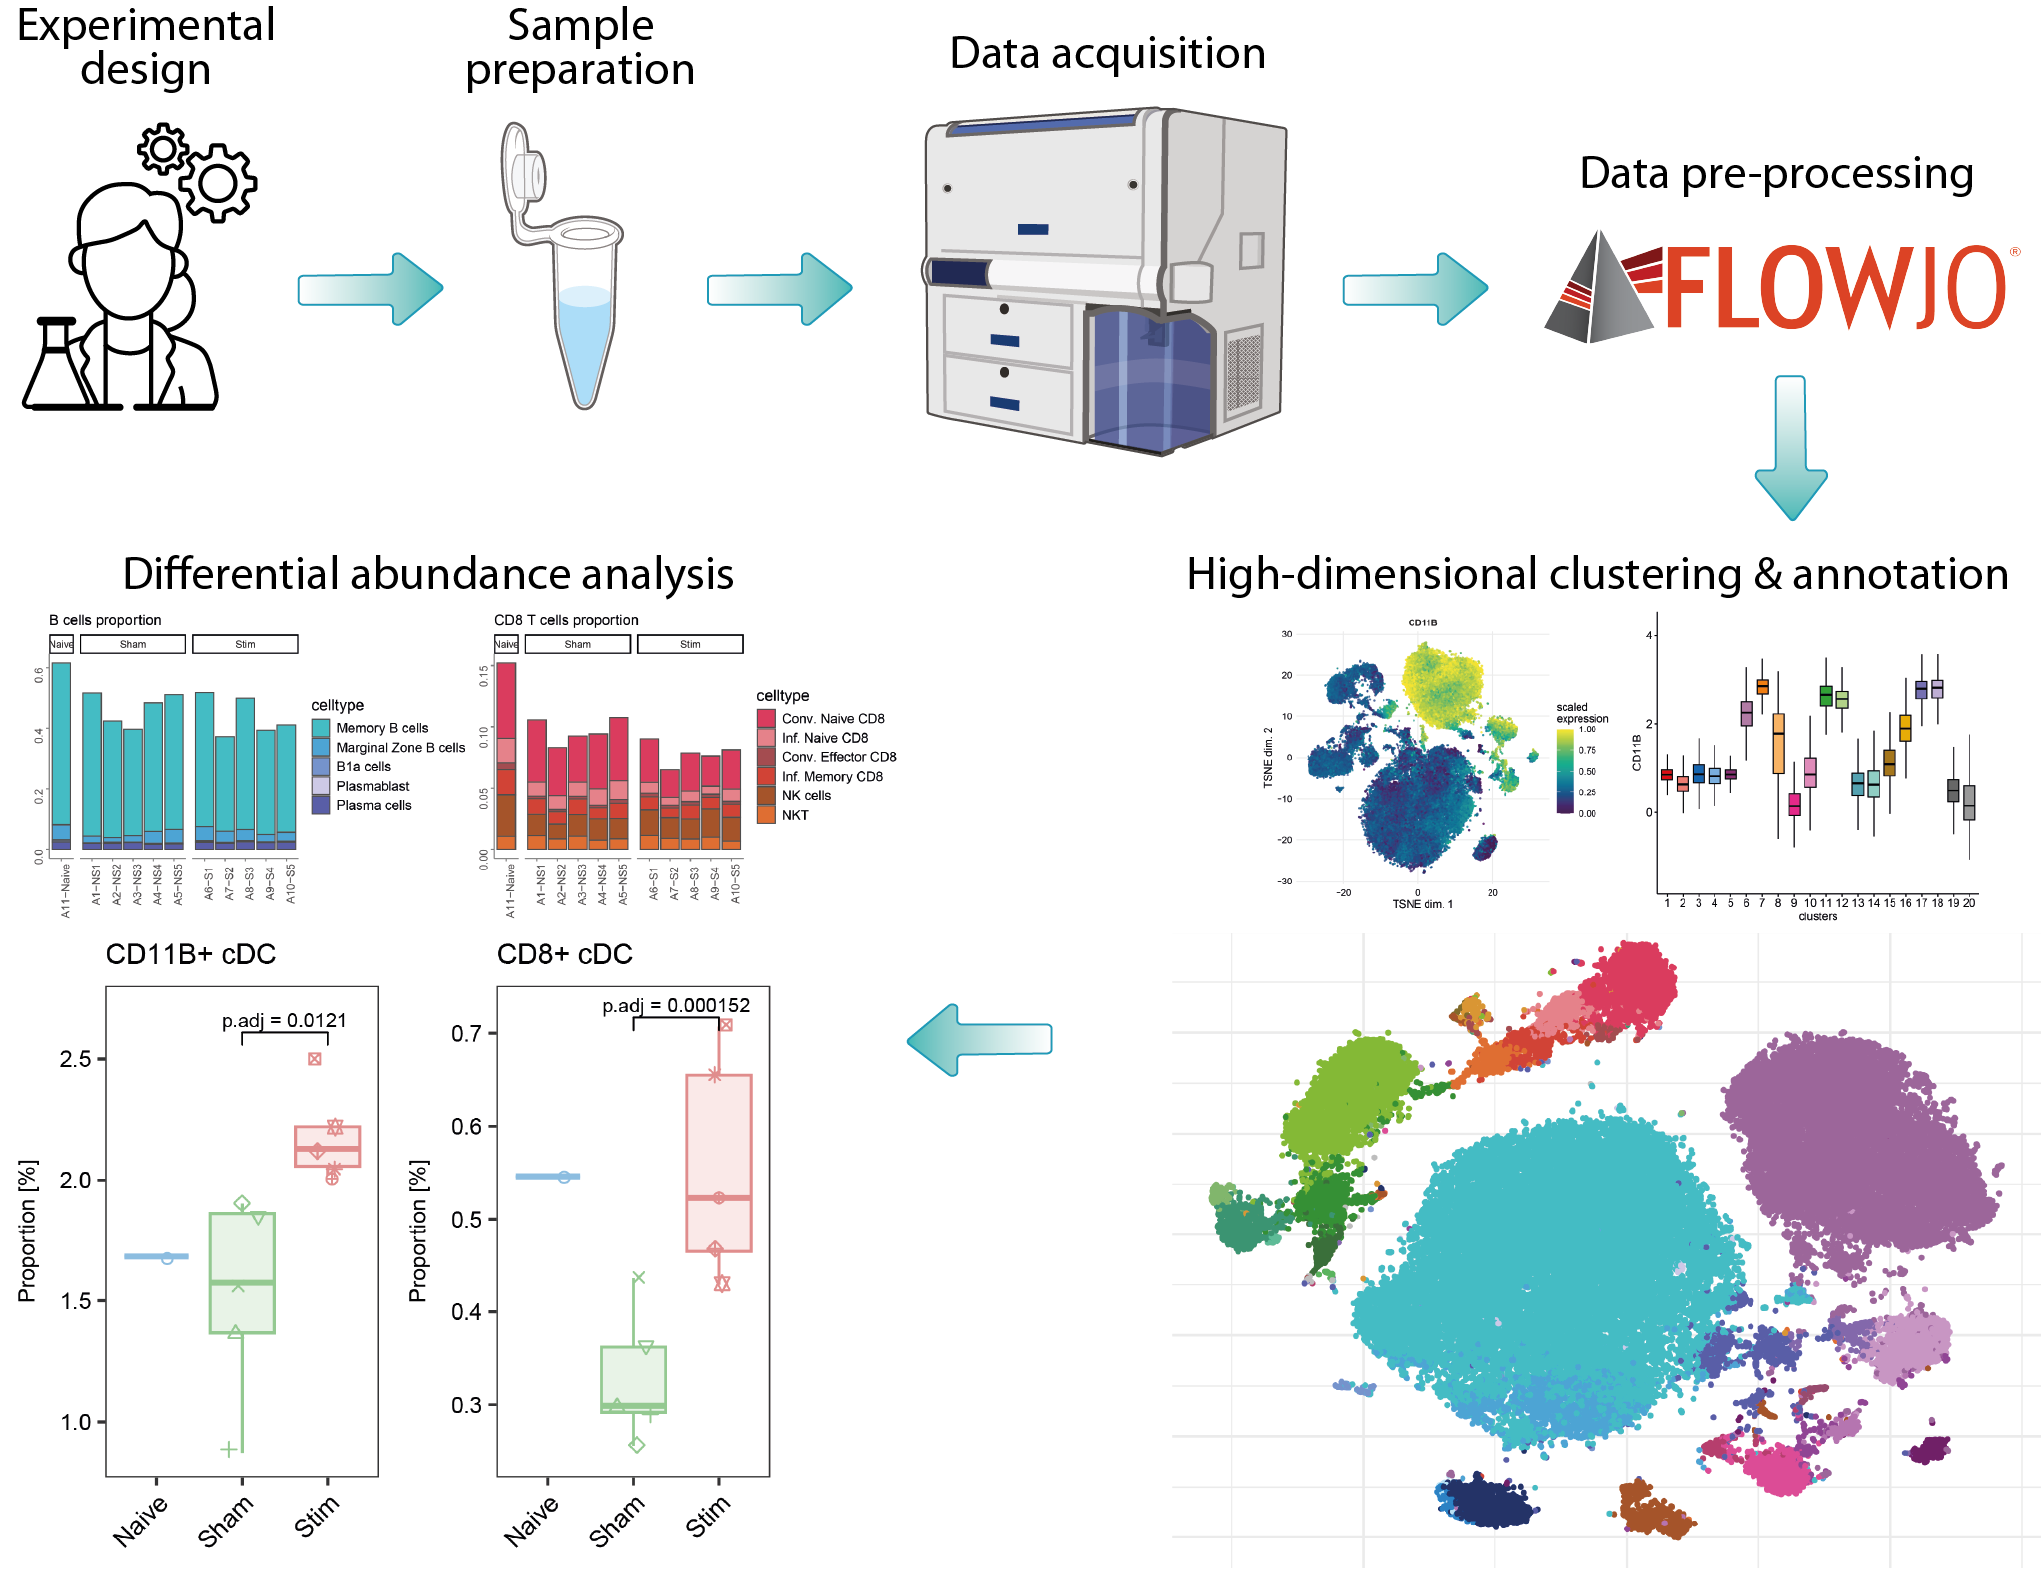
Over the past decade, advancements in full spectrum flow cytometry and isotope labeling techniques have significantly increased the number of quantifiable markers. Combined with higher cellular throughput, these improvements have generated complex, high-dimensional data that requires advanced computational methods to replace traditional manual gating. The analysis of such data from flow or mass cytometry can be divided into three main steps. First, data pre-processing involves removing dead cells, compensation, and verifying marker expression patterns, typically using commercial software like FlowJo or R packages. Second, within an R workflow, quality control checks and data transformation are performed, followed by FlowSOM clustering on the entire cell dataset using all markers to identify populations; this includes an initial coarse clustering followed by subclustering to detect specific cell types or states. Finally, differential analysis using R statistical workflows compares the abundances of particular subpopulations between different conditions.
Go to pipeline documentation