This module is dedicated to the early analysis steps for a project integrating several conditions and replicates per conditions, in case you have ony one sample, please adapt code accordingly. Note that a proper configured conda environment is required to fully operate the code bellow, please refers to associated conda environment to install all necessary python packages required.
01. First, describe your dataset in a .csv file gathering the path, sample_name and associated metadatas such as condition and batch
path,sample,condition,color,batch
output-XETG00161__0019133__slide1__20240709__134744,slide1,#ffd000,WT,RUN1
output-XETG00161__0019133__slide2__20240709__134744,slide2,#ffd000,WT,RUN1
output-XETG00161__0019133__slide3__20240709__134744,slide3,#ffd000,WT,RUN2
output-XETG00161__0019133__slide4__20240709__134744,slide4,#d8f3dc,KO,RUN1
output-XETG00161__0019133__slide5__20240709__134744,slide5,#d8f3dc,KO,RUN2
output-XETG00161__0019133__slide6__20240709__134744,slide6,#d8f3dc,KO,RUN2
02. So you can read the file and iterate throught your 6 samples
import pandas as pd
import scispy as scis
import spatialdata_xenium_explorer

samples = pd.read_csv('samples.csv', sep=',')
for index, row in samples.iterrows():
    print("processing ", row['sample'], " ...")

    # read xenium sample
    sdata = scis.io.load_xenium(row.path)
    # or read merscope sample (z=2 refers to mosaic_DAPI_z2.tif that must be in images subdirectory)
    sdata = scis.io.load_merscope(path=row.path, region_name=row['sample'], z_layers=2, slide_name=row['sample'])

    # add metadata
    sdata.tables["table"].obs['color'] = row.color
    sdata.tables["table"].obs['batch'] = row.batch

    # eventually run a standard scanpy analysis sample per sample
    scis.pp.run_scanpy(sdata, min_counts = 20) # filtering out the cells having less than 20 detected transcripts
    # synchonize shapes to handle filtered cells
    scis.pp.sync_shape(sdata)

    # automatic labeling using home-made or external single-cell reference (.h5ad)
    # ....

    # write SpatialData zarr container
    sdata.write("000-outs/SD_" + row['sample'])

    # xenium: re-export cells metadata as zarr.zip files that could be relocated in initial sample output directory
    spatialdata_xenium_explorer.write("./000-outs/XE_" + str(row['sample']), sdata, shapes_key='cell_boundaries', points_key='transcripts', gene_column='feature_name', layer='counts', polygon_max_vertices=40, mode='-it')
    # merscope: export a fully operational xenium explorer directory
    spatialdata_xenium_explorer.write("000-outs/XE_" + str(row['sample']), sdata, gene_column='gene', layer='counts', polygon_max_vertices=40)

Note that before saving and re-exporting your metadata for a xenium explorer exploration you may wish to perform an automatic labeling of your cells based on home-made or an external single-cell reference. This can be done before saving your sample but you might save computational time by doing this process once after harmony integration. In any case you will need a well-formated Anndata single-cell dataset as reference (.h5ad).
02.bis. Special case for nucleus only quantification of xenium experiments
Concerning early xenium protocol or specific request, you would need to discard the detected transcripts obtained outside the nucleus boudaries. This is particularly usefull when cell boudaries extension procedure have been executed to define the final cell boundaries in early xenium experiment.
samples = pd.read_csv('samples.csv', sep=',')
for index, row in samples.iterrows():
    print("processing ", row['sample'], " ...")

    sdata = scis.io.load_xenium(row.path)
    scis.pp.run_scanpy(sdata, min_counts = 20)

    instance_key = sdata.table.uns["spatialdata_attrs"]["instance_key"]
    sdata.shapes['cell_circles'] = sdata.shapes['cell_circles'].loc[sdata.table.obs[instance_key].tolist()]
    sdata.shapes['nucleus_boundaries'] = sdata.shapes['nucleus_boundaries'].loc[sdata.table.obs[instance_key].tolist()]

    df = pd.DataFrame(sdata['transcripts'].compute())
    df = df[df.overlaps_nucleus == 1]
    df = df[df.cell_id != 'UNASSIGNED']
    df = df[df.qv >= 20]
    df = df[df['feature_name'].isin(sdata.table.raw.var_names)]
    df = df.reset_index(drop=True)
    df = df.reindex(np.arange(len(df)))

    transform = Scale([1.0 / 0.2125, 1.0 / 0.2125], axes=("x", "y"))
    points = PointsModel.parse(
            df,
            coordinates={"x": "x", "y": "y"},
            feature_key="feature_name",
            instance_key="cell_id",
            transformations={"global": transform},
            sort=True,
    )
    sdata.points['nucleus_transcripts'] = points

    sdata_im = sdata.aggregate(values="nucleus_transcripts", by="nucleus_boundaries", value_key="feature_name", agg_func="count")

    # required for harmony
    sdata_im.table.X = sdata_im.table.X.astype('float32')
    sdata.table.layers['counts'] = sdata_im.table.X.copy()
    sdata.table.X = sdata_im.table.X.copy()

    # filter nuclei < 12 detected tr.
    df = pd.DataFrame(sdata.table.layers['counts'].todense(), index=sdata.table.obs.index, columns=sdata.table.var_names)
    sdata.table.obs['transcript_counts'] = df.sum(axis=1).values
    sdata.table.obs['total_counts'] = df.sum(axis=1).values
    sdata.table.obs['n_counts'] = df.sum(axis=1).values
    sc.pp.filter_cells(sdata.table, min_counts=12)

    # resync
    sdata.shapes['cell_boundaries'] = sdata.shapes['cell_boundaries'].loc[sdata.table.obs[instance_key].tolist()]
    sdata.shapes['cell_circles'] = sdata.shapes['cell_circles'].loc[sdata.table.obs[instance_key].tolist()]
    sdata.shapes['nucleus_boundaries'] = sdata.shapes['nucleus_boundaries'].loc[sdata.table.obs[instance_key].tolist()]

    # save
    sdata.table.obs['region'] = 'nucleus_boundaries'
    sdata.table.obs['region'] = sdata.table.obs['region'].astype("category")
    sdata.table.uns["spatialdata_attrs"]["region"] = 'nucleus_boundaries'

    sdata.table.obs['sample'] = str(row['sample'])
    sdata.table.obs['sample'] = sdata.table.obs['sample'].astype('category')

    # write SpatialData zarr container
    sdata.write("000-outs/SD_" + row['sample'])
03. Harmony integration
Spatial experiments can rapidly generate very huge amount of cells, we advise to process to the data integration using the python package rapids_singlecell that allow the computation directly of GPUs, please take care to run this code within a system having access to GPU. First we need to concatenate all samples as one unique anndata object
import spatialdata as sd
from spatialdata import SpatialData

adatas = []
samples = pd.read_csv('samples.csv', sep=',')
for index, row in samples.iterrows():
    sdata = SpatialData.read("000-outs/SD_" + str(row['sample']))
    adatas += [sdata.table]

adata = ad.concat(adatas)
adata.layers['counts'] = adata.layers['counts'].astype('float32')
adata.X = adata.layers['counts'].copy()
adata.X = adata.X.astype('float32')

adata.var_names = adata.raw.var_names
del adata.obsm['X_pca'] # if exists
del adata.obsm['X_umap'] # if exists
The code bellow is based on a rapids-singlecell demo notebook to integrate and analyse a 1 milion mouse brain dataset.
import rmm
import cupy as cp
import rapids_singlecell as rsc
from rmm.allocators.cupy import rmm_cupy_allocator

rmm.reinitialize(
    managed_memory=False,  # Allows oversubscription
    pool_allocator=False,  # default is False
    devices=0,  # GPU device IDs to register. By default registers only GPU 0.
)
cp.cuda.set_allocator(rmm_cupy_allocator)

rsc.get.anndata_to_GPU(adata)
rsc.pp.normalize_total(adata)
rsc.pp.log1p(adata)
rsc.pp.scale(adata, max_value=10)
rsc.tl.pca(adata, n_comps=100)
rsc.get.anndata_to_CPU(adata)
rsc.pp.harmony_integrate(adata, key="sample")
adata.obsm['X_pca'] = adata.obsm['X_pca_harmony']
rsc.pp.neighbors(adata, n_neighbors=15, n_pcs=40)
rsc.tl.umap(adata)
rsc.tl.leiden(adata)
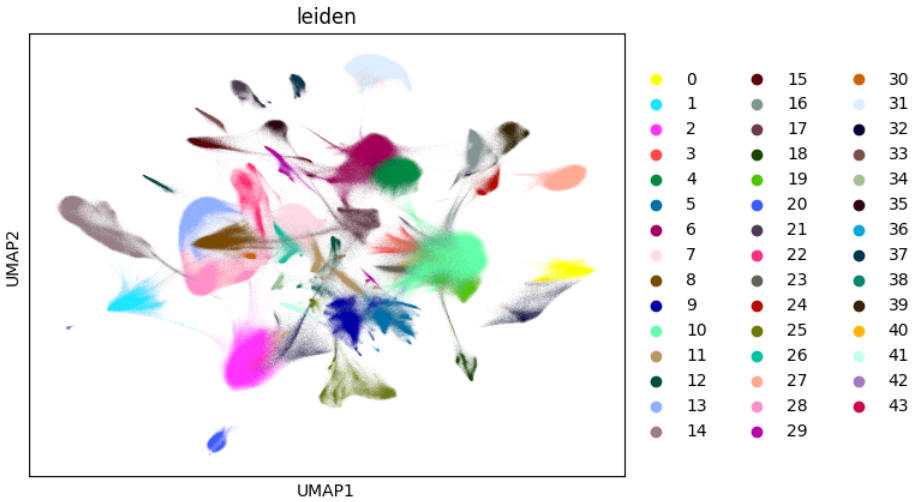
sc.pl.umap(adata, color="leiden")

adata.write('000-outs/ad6.h5ad')
