In_situ_ST-cell_annotation
Transcriptomics Spatial Statistical analysisCrucial step of the statistical analysis process, cell labeling allow to associate each cell to a cell type. This process can be done manually using leiden or louvain clustering and gene markers definition using standard single-cell labeling process as such described within seurat or scanpy standard statistical workflows. Labeling can also be performed by cell scoring using the very specific gene markers selected within the spatial experiment gene panel using standard scoring functions based on gene lists. Here we describe automatic procedure that relies on the grouping into a same latent space of the spatial cells and cells coming from an home-made or external single-cell reference, based on the transcriptome of the common genes.
Module specifications
| Input data | Computational environnement | Output data |
|---|---|---|
|
SpatialData, AnnData |
spatial in-situ imaging-based Python |
SpatialData, AnnData |
Code
Here we describe an automatic labeling procedure using scanvi and/or scMusketeers that relies on mixing spatial cells and a home-made or external single-cell reference cells into a unique latent space to predict spatial cells cell type. Obviously the single-cell reference needs to be as close as possible as the spatial dataset in term of cell type occurence.
scanvi automatic labeling
Home-made or external single-cell reference used for transfert labeling needs to be prepared before automatic labeling could be performed. Reference AnnData object needs to have a layer 'counts' filled with either raw or log-normalized counts and a cell type field (ClusterName for zeisel et al., 2018) in the .obs metadata. On bego, some references are already available for mouse brain dataset based on 2 references publications:
* Yao et al. (2023)
* Zeisel et al. (2018)
import scanpy as sc
import scispy as scis

# Yao et al. (2023) 10xGenomics  mouse brain 247 genes panel
scref_yao2023 = sc.read_h5ad('~/000-Atlas-references/mousebrain_247g_raw_4M_10p.h5ad')
scref_yao2023.layers['counts'] = scref_yao2023.X.copy()

# Zeisel et al. (2018) - whole CNS
scref_zeisel2018 = sc.read_h5ad('~/000-Atlas-references/zeisel_2018_CNS.h5ad')
# Zeisel et al. (2018) - coronal section
scref_zeisel2018 = sc.read_h5ad('~/000-Atlas-references/zeisel_2018_coronal.h5ad')
scref_zeisel2018.layers['counts'] = scref_zeisel2018.raw.X.copy()

# read your spatial dataset
ad6_harmony = sc.read_h5ad('000-outs/ad6.h5ad')
# transfert annotation
scis.pp.scvi_annotate(ad6_harmony, scref_zeisel2018, batch_size=127, label_ref='ClusterName', label_key='scanvi', metaref2add=['TaxonomyRank1','TaxonomyRank2','TaxonomyRank3','TaxonomyRank4','Region'])
ad6_harmony.var_names = ad6_harmony.raw.var_names

# save your annotate dataset
ad6_harmony.write('000-outs/ad6_scanvi.h5ad')
scMusketeers automatic labeling
import scanpy as sc

# parameters
class_key = "scmusk"
unlabeled_category = "Unknown"
batch_key = "sample"
h5ad_ref = "~/000-Atlas-references/zeisel_2018_coronal.h5ad"
h5ad_query = '000-outs/ad6_scanvi.h5ad'

# prepare ref
ref = sc.read_h5ad(h5ad_ref)
ref.obs = ref.obs.reset_index(drop=True)
ref.obs.index = ref.obs.index.map(str)
ref.X = ref.raw.X.copy()
ref.obs[class_key] = ref.obs['ClusterName']
# arrange a random batch
s = [random.randrange(1, 4) for _ in range(0, ref.shape[0])]
ref.obs[batch_key] = s
ref.obs[batch_key] = ref.obs[batch_key].map(str)
ref.var_names_make_unique()
ref.obs_names_make_unique()
ref.write('ref.h5ad')

# prepare query
query = sc.read_h5ad(h5ad_query)
query.obs = query.obs.reset_index(drop=True)
query.obs.index = query.obs.index.map(str)
query.X = query.layers['counts'].copy()
query.obs[class_key] = unlabeled_category
query.var_names_make_unique()
query.obs_names_make_unique()
query.write('query.h5ad')
scMusketeers need to be run as command line within a specific conda environnement on bego
conda activate /data/analysis/ML_models/conda_env/cb_scmusketeers
sc-musketeers transfer ref.h5ad --query_path query.h5ad --class_key=scmusk --unlabeled_category=Unknown --batch_key=sample --out_dir=. --out_name=scmusk.pred
Then get back to python notebook
import anndata as ad

pred = sc.read_h5ad("scmusk.pred.h5ad")
pred = pred[pred.obs.train_split == 'test']

pred.obs.index = query.obs.index

query.obs['scmusk'] = adata_pred.obs['scmusk_pred']
query.obs['scmusk'] = query.obs['scmusk'].astype("category")

query.write('000-outs/ad6_scanvi_scmusk.h5ad')
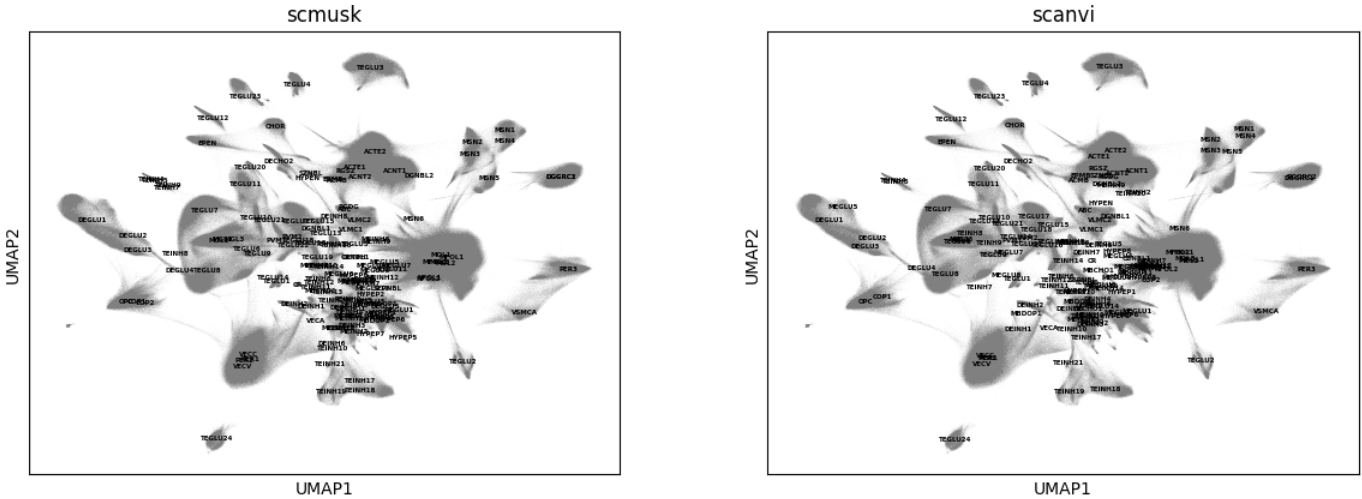
Visualize UMAP by cell type
sc.pl.embedding(query, "umap", color=['scmusk','scanvi'], legend_loc='on data', legend_fontsize=4)

Re-export metadata for xenium explorer
samples = pd.read_csv('samples.csv', sep=',')
for index, row in samples.iterrows():
    sdata = SpatialData.read("000-outs/SD_" + row['sample'])
    sub = query[query.obs['sample'] == row['sample']]

    sub.uns["spatialdata_attrs"] = sdata.table.uns["spatialdata_attrs"]
    sub.obs.cell_id = sub.obs.cell_id.astype(str)
    del sdata.tables["table"]
    sdata.tables["table"] = sub

    # xenium case
    spatialdata_xenium_explorer.write("000-outs/XE_" + row['sample'], sdata, shapes_key='cell_boundaries', points_key='transcripts', image_key='morphology_focus', polygon_max_vertices=40, mode='+o')


