droplet-based single-cell RNAseq
Analysis of single-cell gene expression data generated by droplet-based systems
https://www.10xgenomics.com/platforms/chromium
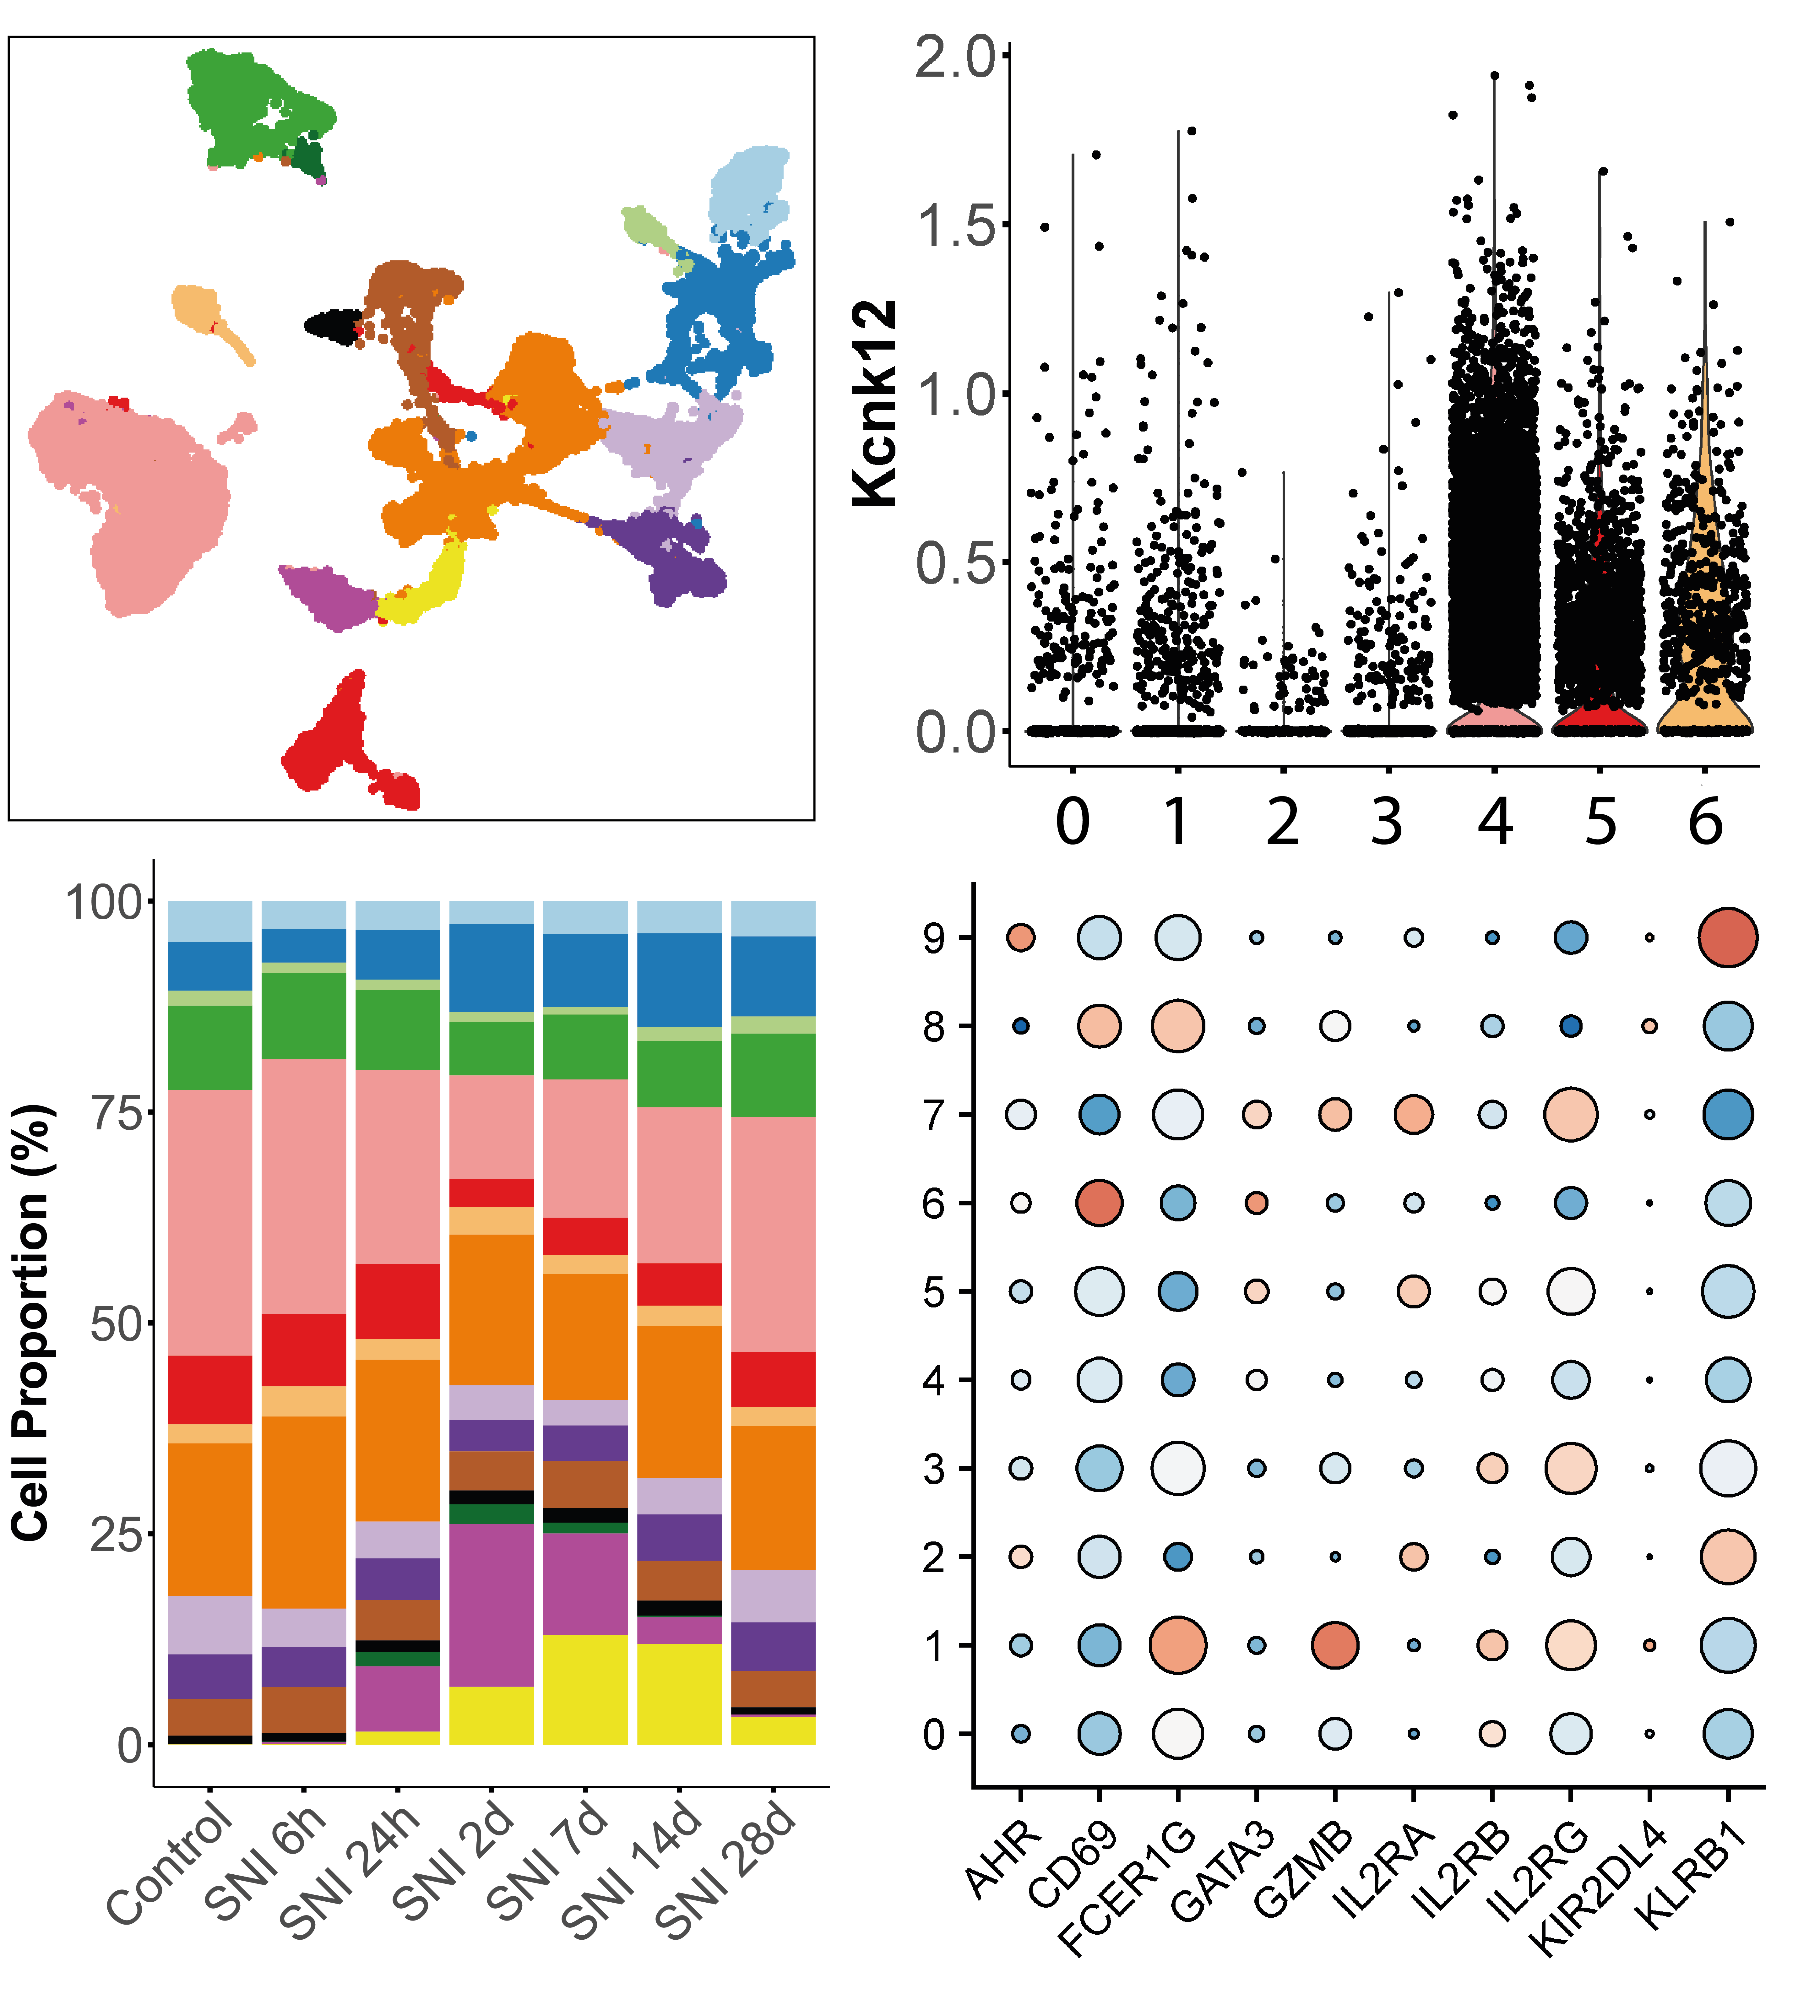
The analysis of single-cell gene expression data generated by droplet-based systems such as the 10X Genomics Chromium system involves several key steps. First, raw sequencing data are processed to generate gene expression matrices, which quantify the expression levels of genes in individual cells. Next, several data transformation steps are carried out to extract the biological variability that distinguishes communities of cells that share a common transcriptomic identity, reflecting their function or responses to stimuli. Finally, several statistical analyses can be carried out to quantify changes in tissue distribution or expression profiles for each of the populations identified, between different experimental conditions.
Required assays
| assay | omic | resolution | link |
|---|---|---|---|
| Single-cell gene expression | Transcriptomics | Single-cell | https://pmc.ncbi.nlm.nih.gov/articles/PMC9479272/ |
Modules list
| Module | Type | Implementation | Description |
|---|---|---|---|
| scRNAseq-cell_ranger | Primary analysis | Bash | The primary analysis of raw sequencing files can be performed with several pipelines, notably the Cellranger pipeline developed by 10X Genomics. Cellranger uses predefined positions for adapter sequences, barcodes, and cDNA sequences, and employs the STAR alignment software to align reads to the reference genome. Reads that are not aligned or of poor quality are eliminated, and annotations are used to define exonic, intronic, and intergenic reads. The transcripts per cell quantification is based on counting Unique Molecular Identifiers (UMIs) for reads confidently aligned to the transcriptome and associated to a single cell barcode. This module is usually performed by the platform that owns the 10x Genomics Chromium system, such as UCAGenomiX. |
| scRNAseq-integration_of_multiple_samples | Secondary Analysis | R | Sequencing multiple samples is essential for understanding tissue organization, experimental variations, and dynamic processes like treatment responses. Technical variabilities, known as "batch effects" can introduce unwanted biases in the data, potentially skewing biological conclusions. Successful data integration corrects these batch effects while preserving biological variability. This vignette will demonstrate the use of Harmony R package to integrate 18 Chromium samples. |
| scRNAseq-cell_annotation | Statistical analysis | R | Cell annotation is the process of assigning labels to the cell clusters, by linking their transcriptionnal signatures to the cell type, state, function, location or lineage they reflect. The main challenges of cell annotation are first to extract a relevant list of marker genes that are specifically characterising the expression profils, and then associate those markers to biological meaning based on empirical knowledge. As this task can be quite laborious, label transfer methods leveraging on already annotated datasets can be use to facilitate the process. |
| scRNAseq-differential_abundance_analysis | Statistical analysis | R | The aim of differential abundance (DA) analysis is to statistically compare the repartition of cell populations defined by clustering between conditions. Several methods are available, some inspired from flow cytometry analysis, others designed for scRNA-seq data. The DA analysis provided in this module is based on the NB GLM methods implemented in the edgeR package. |
| scRNAseq-differential_expression_analysis | Statistical analysis | R | Differential expression analysis (DEA) aims to quantify variations in gene expression between cell populations or between conditions. Basically, for each gene, it consists in measuring the difference in its mean abundance between 2 groups and assessing whether this difference is statistically credible by means of a hypothesis test. The DEA provided in this module is both based on two different approaches, whose use depends on the number of sequenced samples that can be considered biological replicates. |
Reference publications
| title | authors | doi |
|---|---|---|
| Aging affects reprogramming of murine pulmonary capillary endothelial cells after lung injury | Marin Truchi 1*, Grégoire Savary 2*, Marine Gautier-Isola 1, Hugo Cadis 1, Alberto Baeri 1, Arun Lingampally 3, Célia Scribe 1, Virginie Magnone 1, Cédric Girard-Riboulleau 1, Marie-Jeanne Arguel 1, Clémentine de Schutter 2, Julien Fassy 1, Nihad Boukrout 2, Romain Larrue 2, Nathalie Martin 2, Roger Rezzonico 1, Olivier Pluquet 2, Michael Perrais 2, Véronique Hofman 4, Charles-Hugo Marquette 5, Paul Hofman 4, Andreas Günther 6,7, Nicolas Ricard 8, Pascal Barbry 1, Sylvie Leroy 1,5, Kevin Lebrigand 1, Saverio Bellusci 3, Christelle Cauffiez 2, Georges Vassaux 1, Nicolas Pottier 2* and Bernard Mari 1*# | https://www.biorxiv.org/content/10.1101/2023.07.11.548522v1 |
| Detecting subtle transcriptomic perturbations induced by lncRNAs knock-down in single-cell CRISPRi screening using a new sparse supervised autoencoder neural network | Marin Truchi 1, Caroline Lacoux 1, Cyprien Gille 2, Julien Fassy 1, Virginie Magnone 1, Rafael Lopes Goncalves 1, Cédric Girard-Riboulleau 1, Iris Manosalva-Pena 3, Marine Gautier-Isola 1, Kevin Lebrigand 1, Pascal Barbry 1, Salvatore Spicuglia 3, Georges Vassaux 1, Roger Rezzonico 1, Michel Barlaud 2, Bernard Mari 1 | https://pubmed.ncbi.nlm.nih.gov/38501112/ |


