high-dimensional cytometry
Analysis of high-dimensional cytometry data generated by flow or mass cytometry systems
https://pmc.ncbi.nlm.nih.gov/articles/PMC10626267/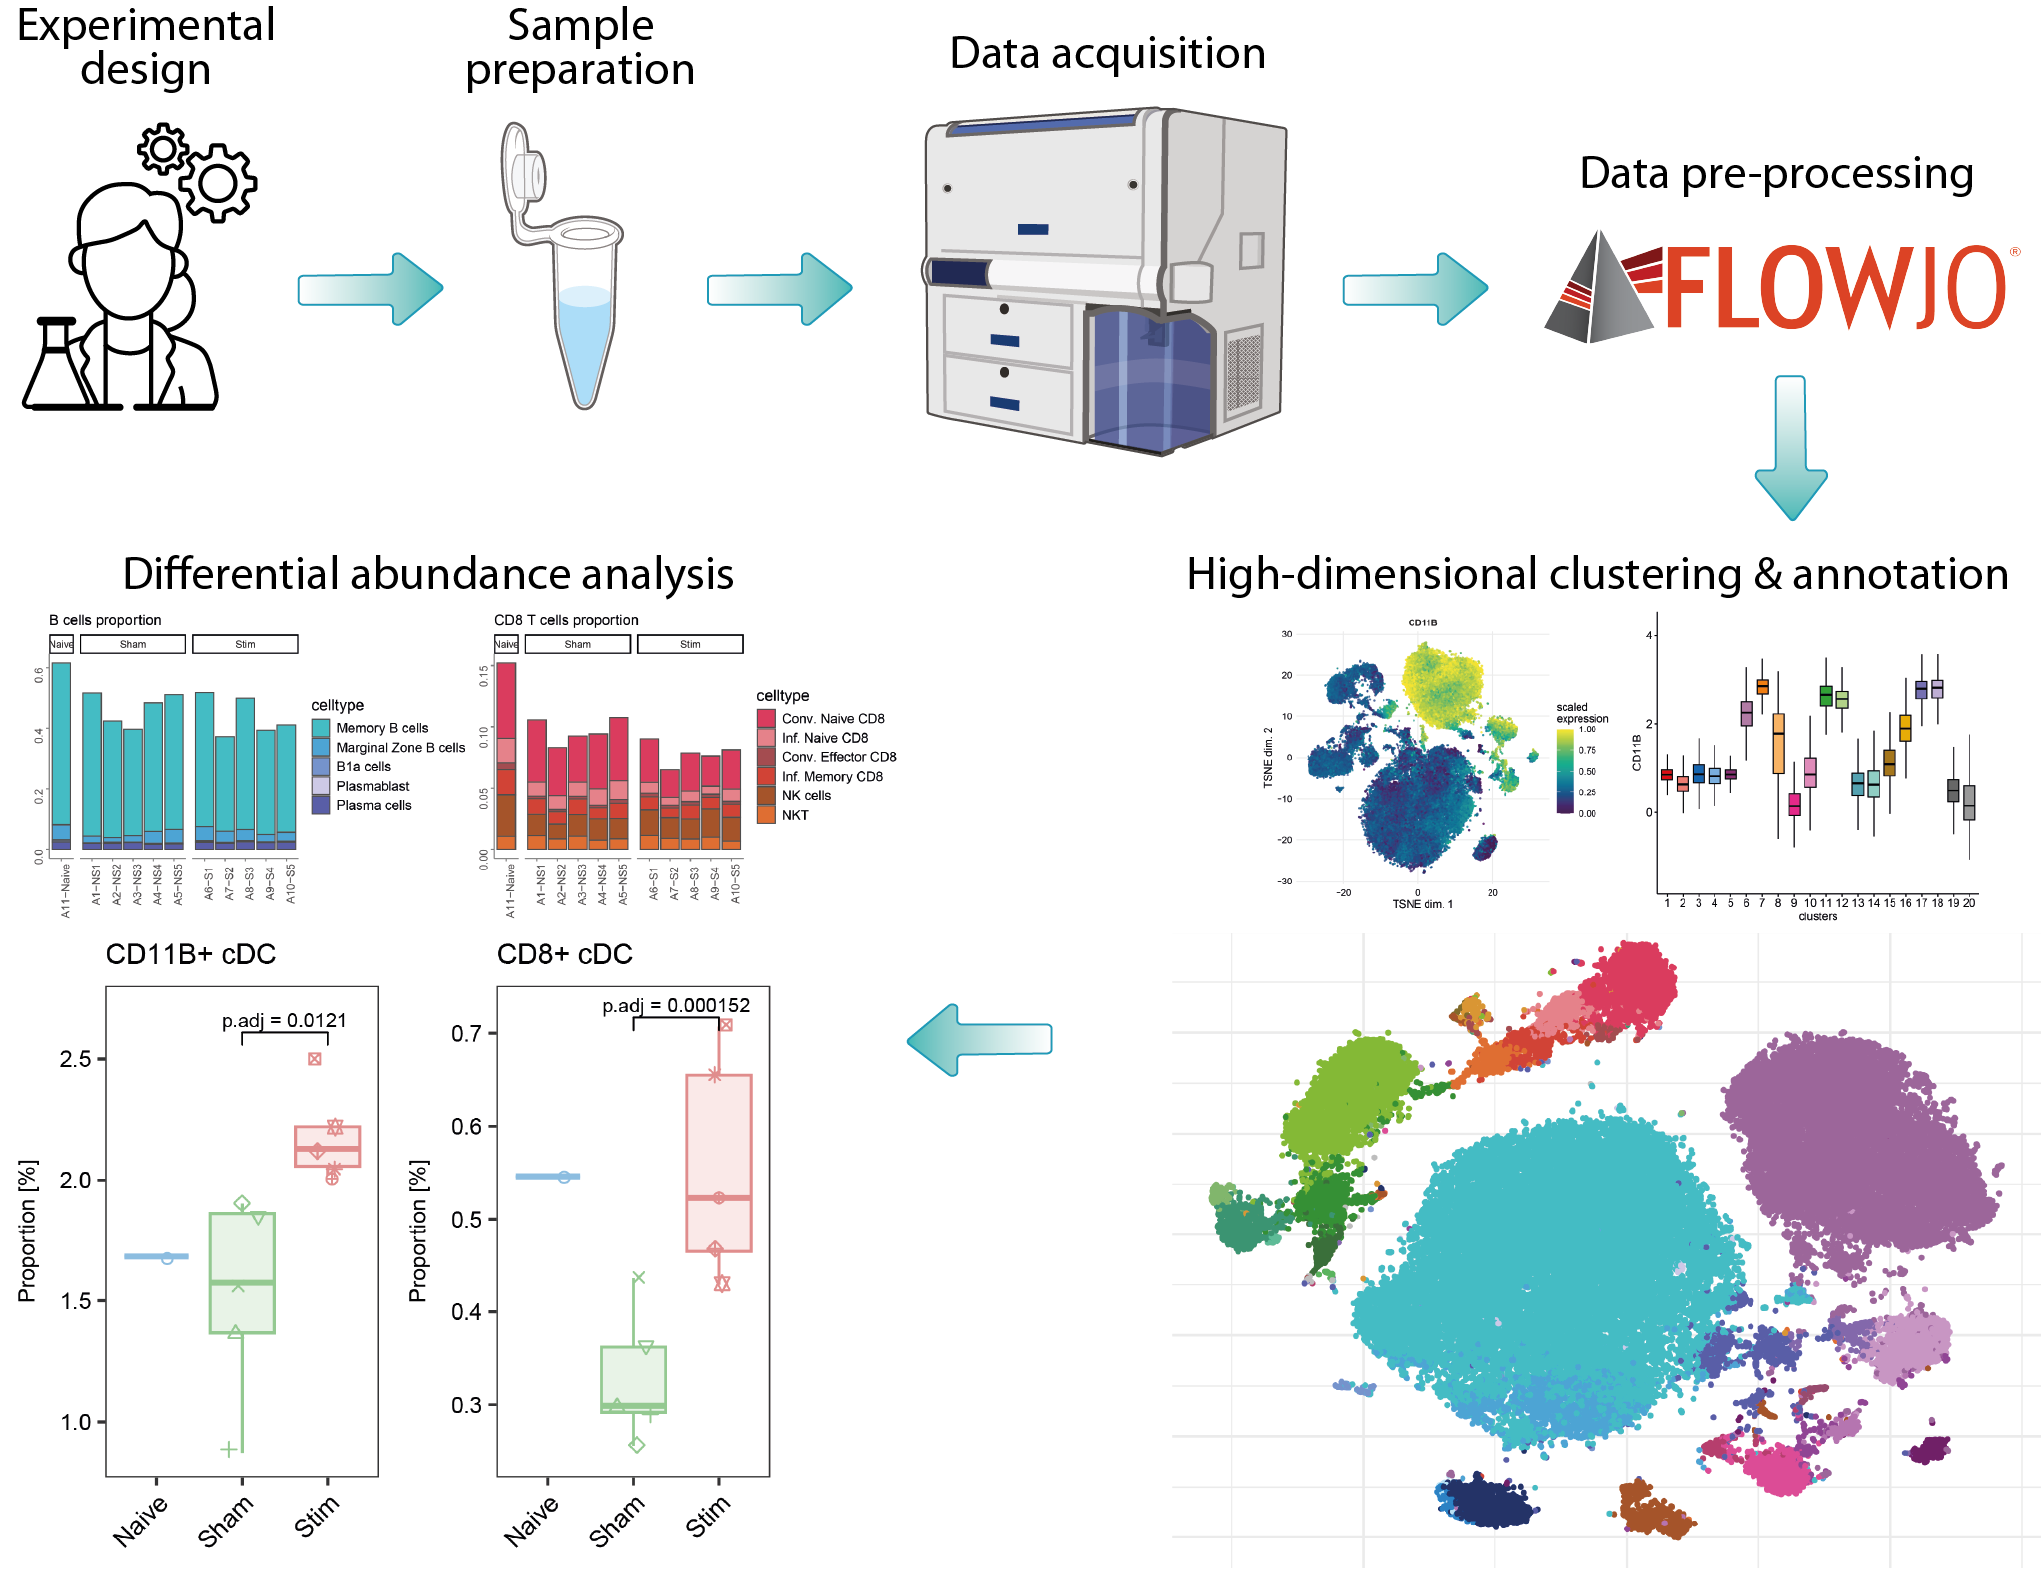
Over the past decade, advancements in full spectrum flow cytometry and isotope labeling techniques have significantly increased the number of quantifiable markers. Combined with higher cellular throughput, these improvements have generated complex, high-dimensional data that requires advanced computational methods to replace traditional manual gating. The analysis of such data from flow or mass cytometry can be divided into three main steps. First, data pre-processing involves removing dead cells, compensation, and verifying marker expression patterns, typically using commercial software like FlowJo or R packages. Second, within an R workflow, quality control checks and data transformation are performed, followed by FlowSOM clustering on the entire cell dataset using all markers to identify populations; this includes an initial coarse clustering followed by subclustering to detect specific cell types or states. Finally, differential analysis using R statistical workflows compares the abundances of particular subpopulations between different conditions.
Required assays
| assay | omic | resolution | link |
|---|---|---|---|
| Spectral flow cytometry | Cytometry | Single-cell | https://www.nature.com/articles/s41592-023-02042-3 |
Modules list
| Module | Type | Implementation | Description |
|---|---|---|---|
| Cytometry-high_resolution_clustering | Secondary Analysis | R | This module takes pre-processed cytometry data from several samples to run high resolution clustering. The workflow begins by reading protein abundance files (.fcs), which are combined with samples metadata to build a SingleCellExperiment object. After data transformation, quality control checks are performed to ensure data integrity and consistency across samples. The module then applies FlowSOM clustering to identify cell populations, followed by subclustering of specific immune subsets. Each subset undergoes detailed analysis, including 2D visualization techniques, and annotation based on marker intensities. |
| Cytometry-differential_abundance_analysis | Statistical analysis | R | Differential analysis of cell population abundance is conducted to compare cell type proportions across experimental conditions, with statistical results visualized through boxplots. Tests for differential abundance of clusters are calculated using generalized linear mixed models implemented in the diffcyt R package. |
Reference publications
| title | authors | doi |
|---|