mass-spectrometry-based lipidomics
Analysis of mass-spectrometry-based lipidomics data
https://bmcbioinformatics.biomedcentral.com/articles/10.1186/1471-2105-15-S7-S9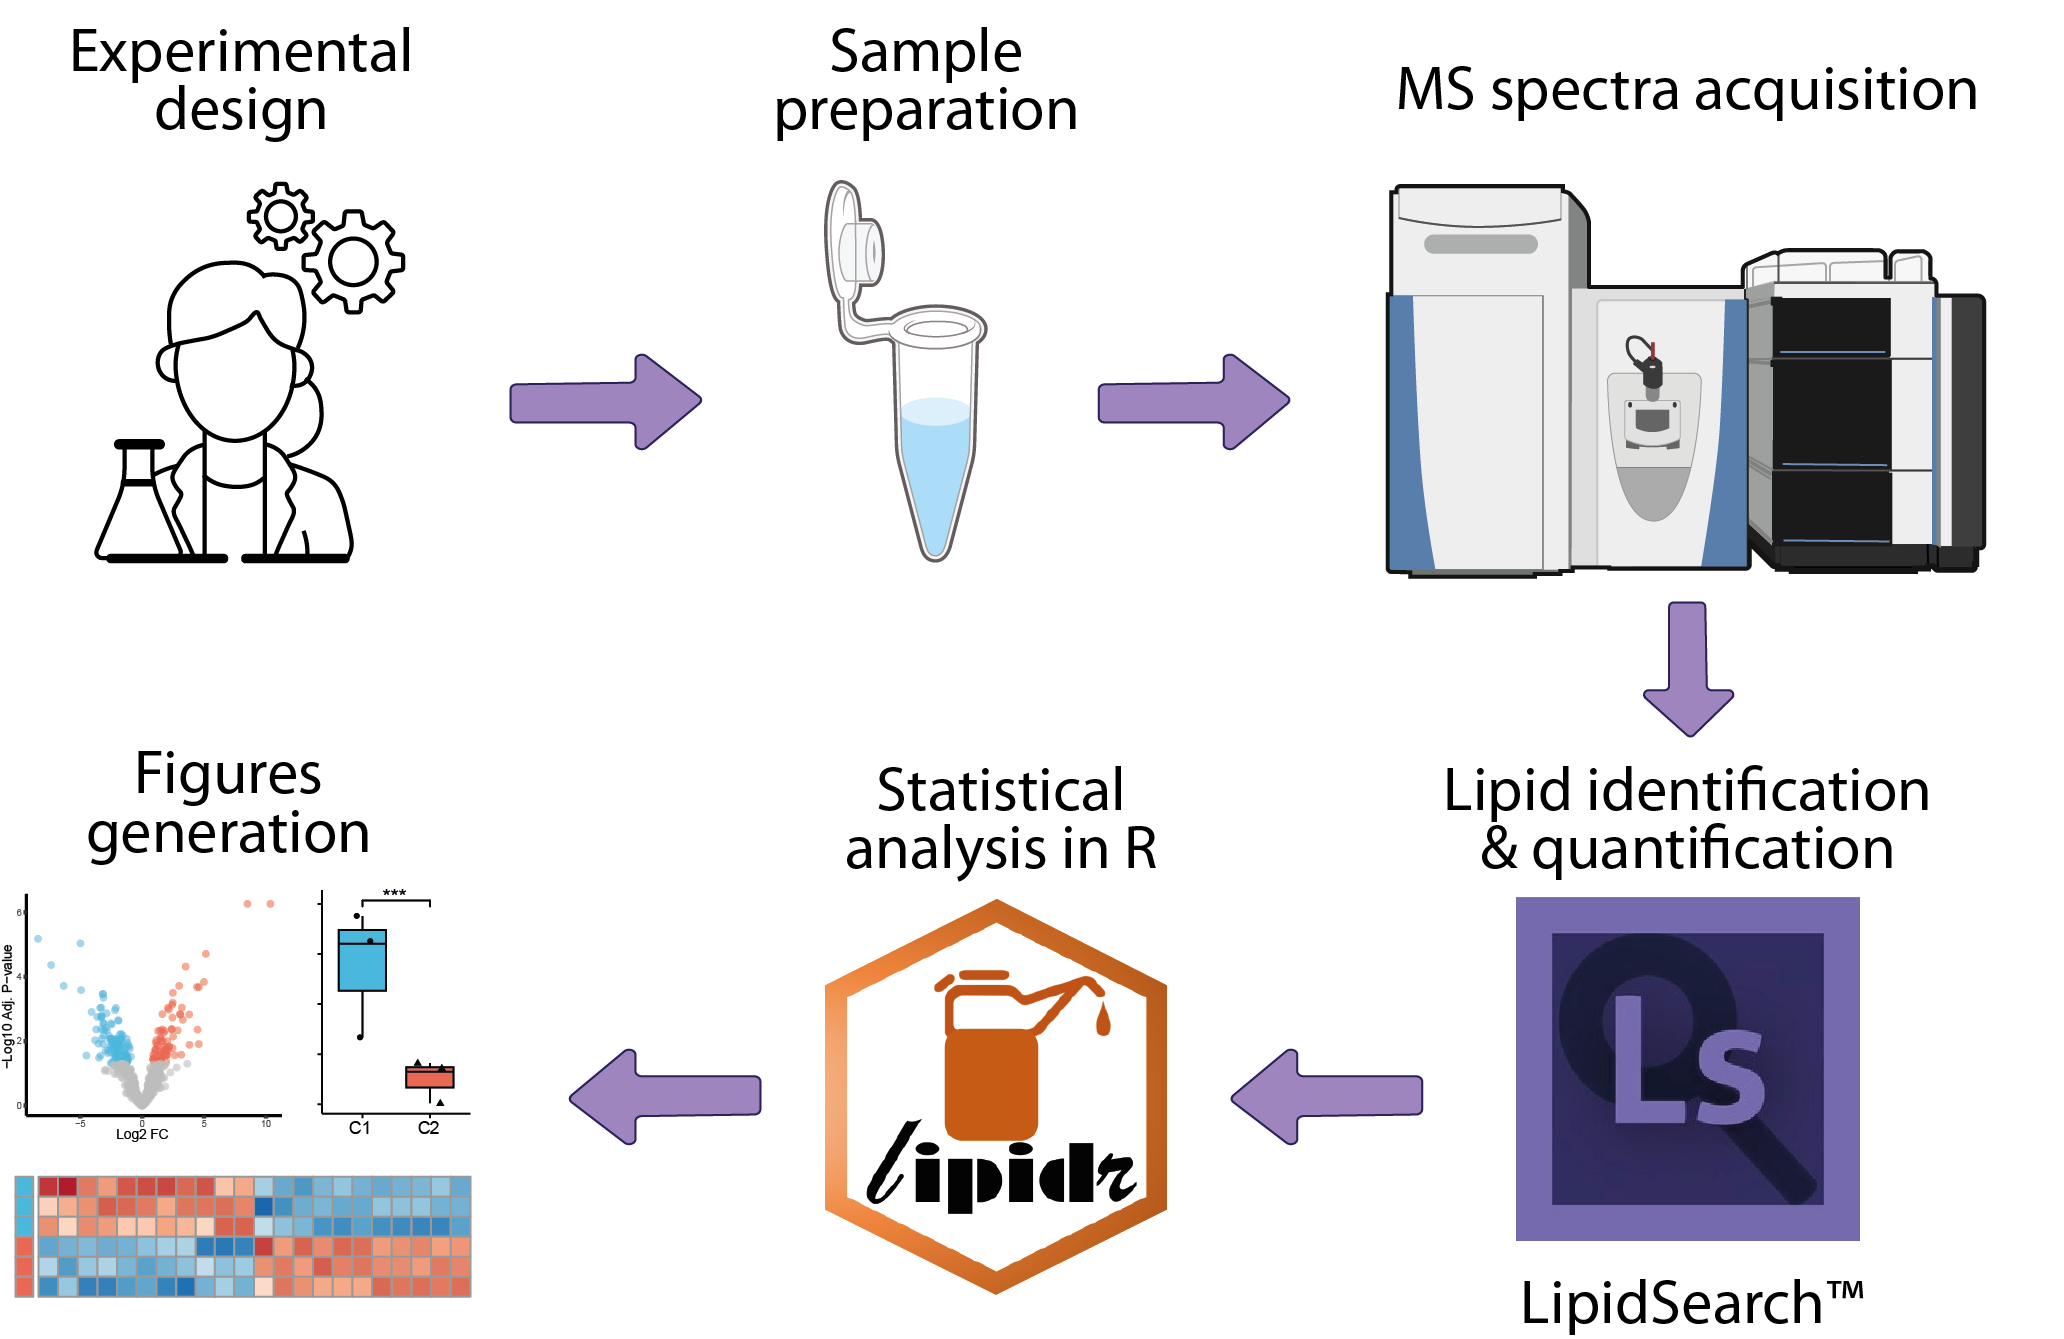
The analysis of mass-spectrometry-based lipidomics data begins with the collection of raw mass spectrometry data. The next step involves lipid identification, where spectra are matched to known lipid molecules using specialized algorithms, followed by lipid quantification. This primary analysis is typically conducted by the platform managing the mass spectrometer, utilizing dedicated software such as LipidSearch. The resulting data can then be statistically analyzed within an R framework to identify lipids differentially quantified between conditions.
Required assays
Modules list
| Module | Type | Implementation | Description |
|---|---|---|---|
| MS_based_lipidomics-Peak_area_analysis | Statistical analysis | R | This module shows how to use Lipidr, a R/Bioconductor package designed for the analysis of quantitative MS-based lipidomics datasets. First, sample information and lipid quantification matrix are processed to build a LipidExperiment object that integrates lipid annotations. After quality control checks, the data are normalized using PQN to ensure balanced peak area across samples. Sample correlations and PCA are used to explore relationships between samples. Finaly OPLS-DA and differential analysis based on limma are performed to identify differentially expressed lipids between conditions, which are represented in heatmaps and volcano plots. |
Reference publications
| title | authors | doi |
|---|