mass-spectrometry-based proteomics
Analysis of mass-spectrometry-based proteomics data
https://www.nature.com/articles/nprot.2016.136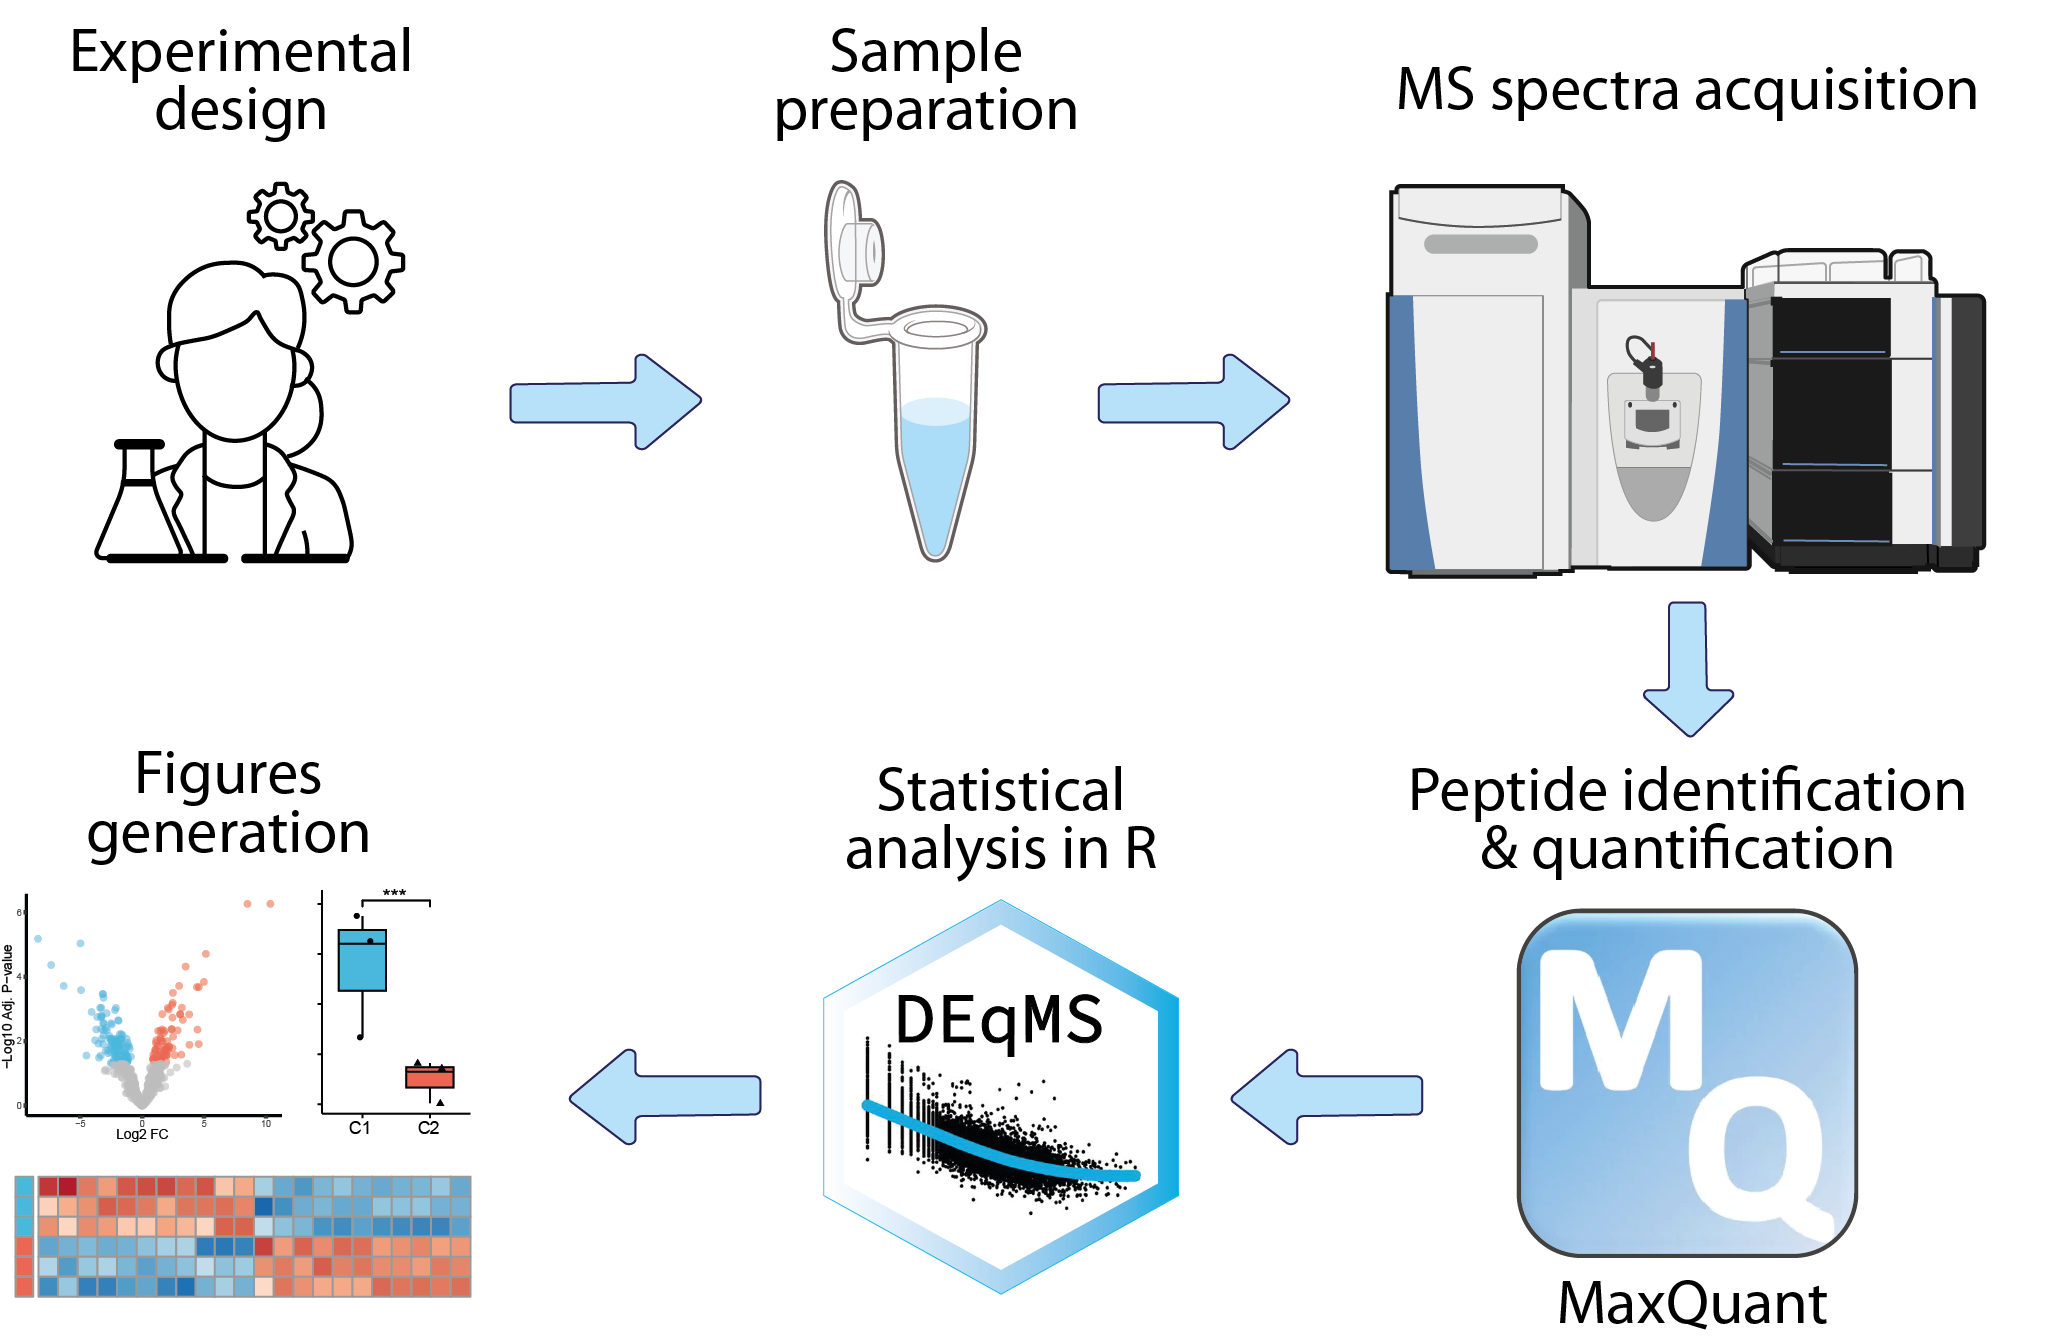
The analysis of mass-spectrometry-based proteomics data begins with the collection of raw mass spectrometry data, which is then preprocessed to remove noise, align spectra, and identify peptide peaks. The next step involves peptide identification, where spectra are matched to known peptide sequences using specialized algorithms. Peptides are subsequently quantified across samples using various strategies, and their associated proteins are identified. This primary analysis is typically conducted by the platform managing the mass spectrometer, utilizing dedicated software such as MaxQuant. The resulting data can then be statistically analyzed within an R framework to identify differentially expressed proteins and enriched biological pathways.
Required assays
| assay | omic | resolution | link |
|---|---|---|---|
| Peptide MS-MS spectra data | Proteomics | Bulk | https://www.nature.com/articles/nature19949 |
Modules list
| Module | Type | Implementation | Description |
|---|---|---|---|
| MS_based_proteomics-LFQ_data_analysis | Statistical analysis | R | Differential analysis of MS-data to identify biomarkers or to understand biology is a cornerstone in proteomics. DEqMS is a robust method for analysis of both labelled and label-free MS-data. The method takes into account the inherent dependence of protein variance on the number of PSMs or peptides used for quantification, thereby providing a more accurate variance estimation and overall a better statistical power for quantitative proteomics analysis. This module shows how to perform DEqMS on LFQ intensities extracted from MaxQuant outputs, and how to run a quick Gene Set Enrichment Analysis to add some biological context to the list of differentially expressed proteins. |
Reference publications
| title | authors | doi |
|---|