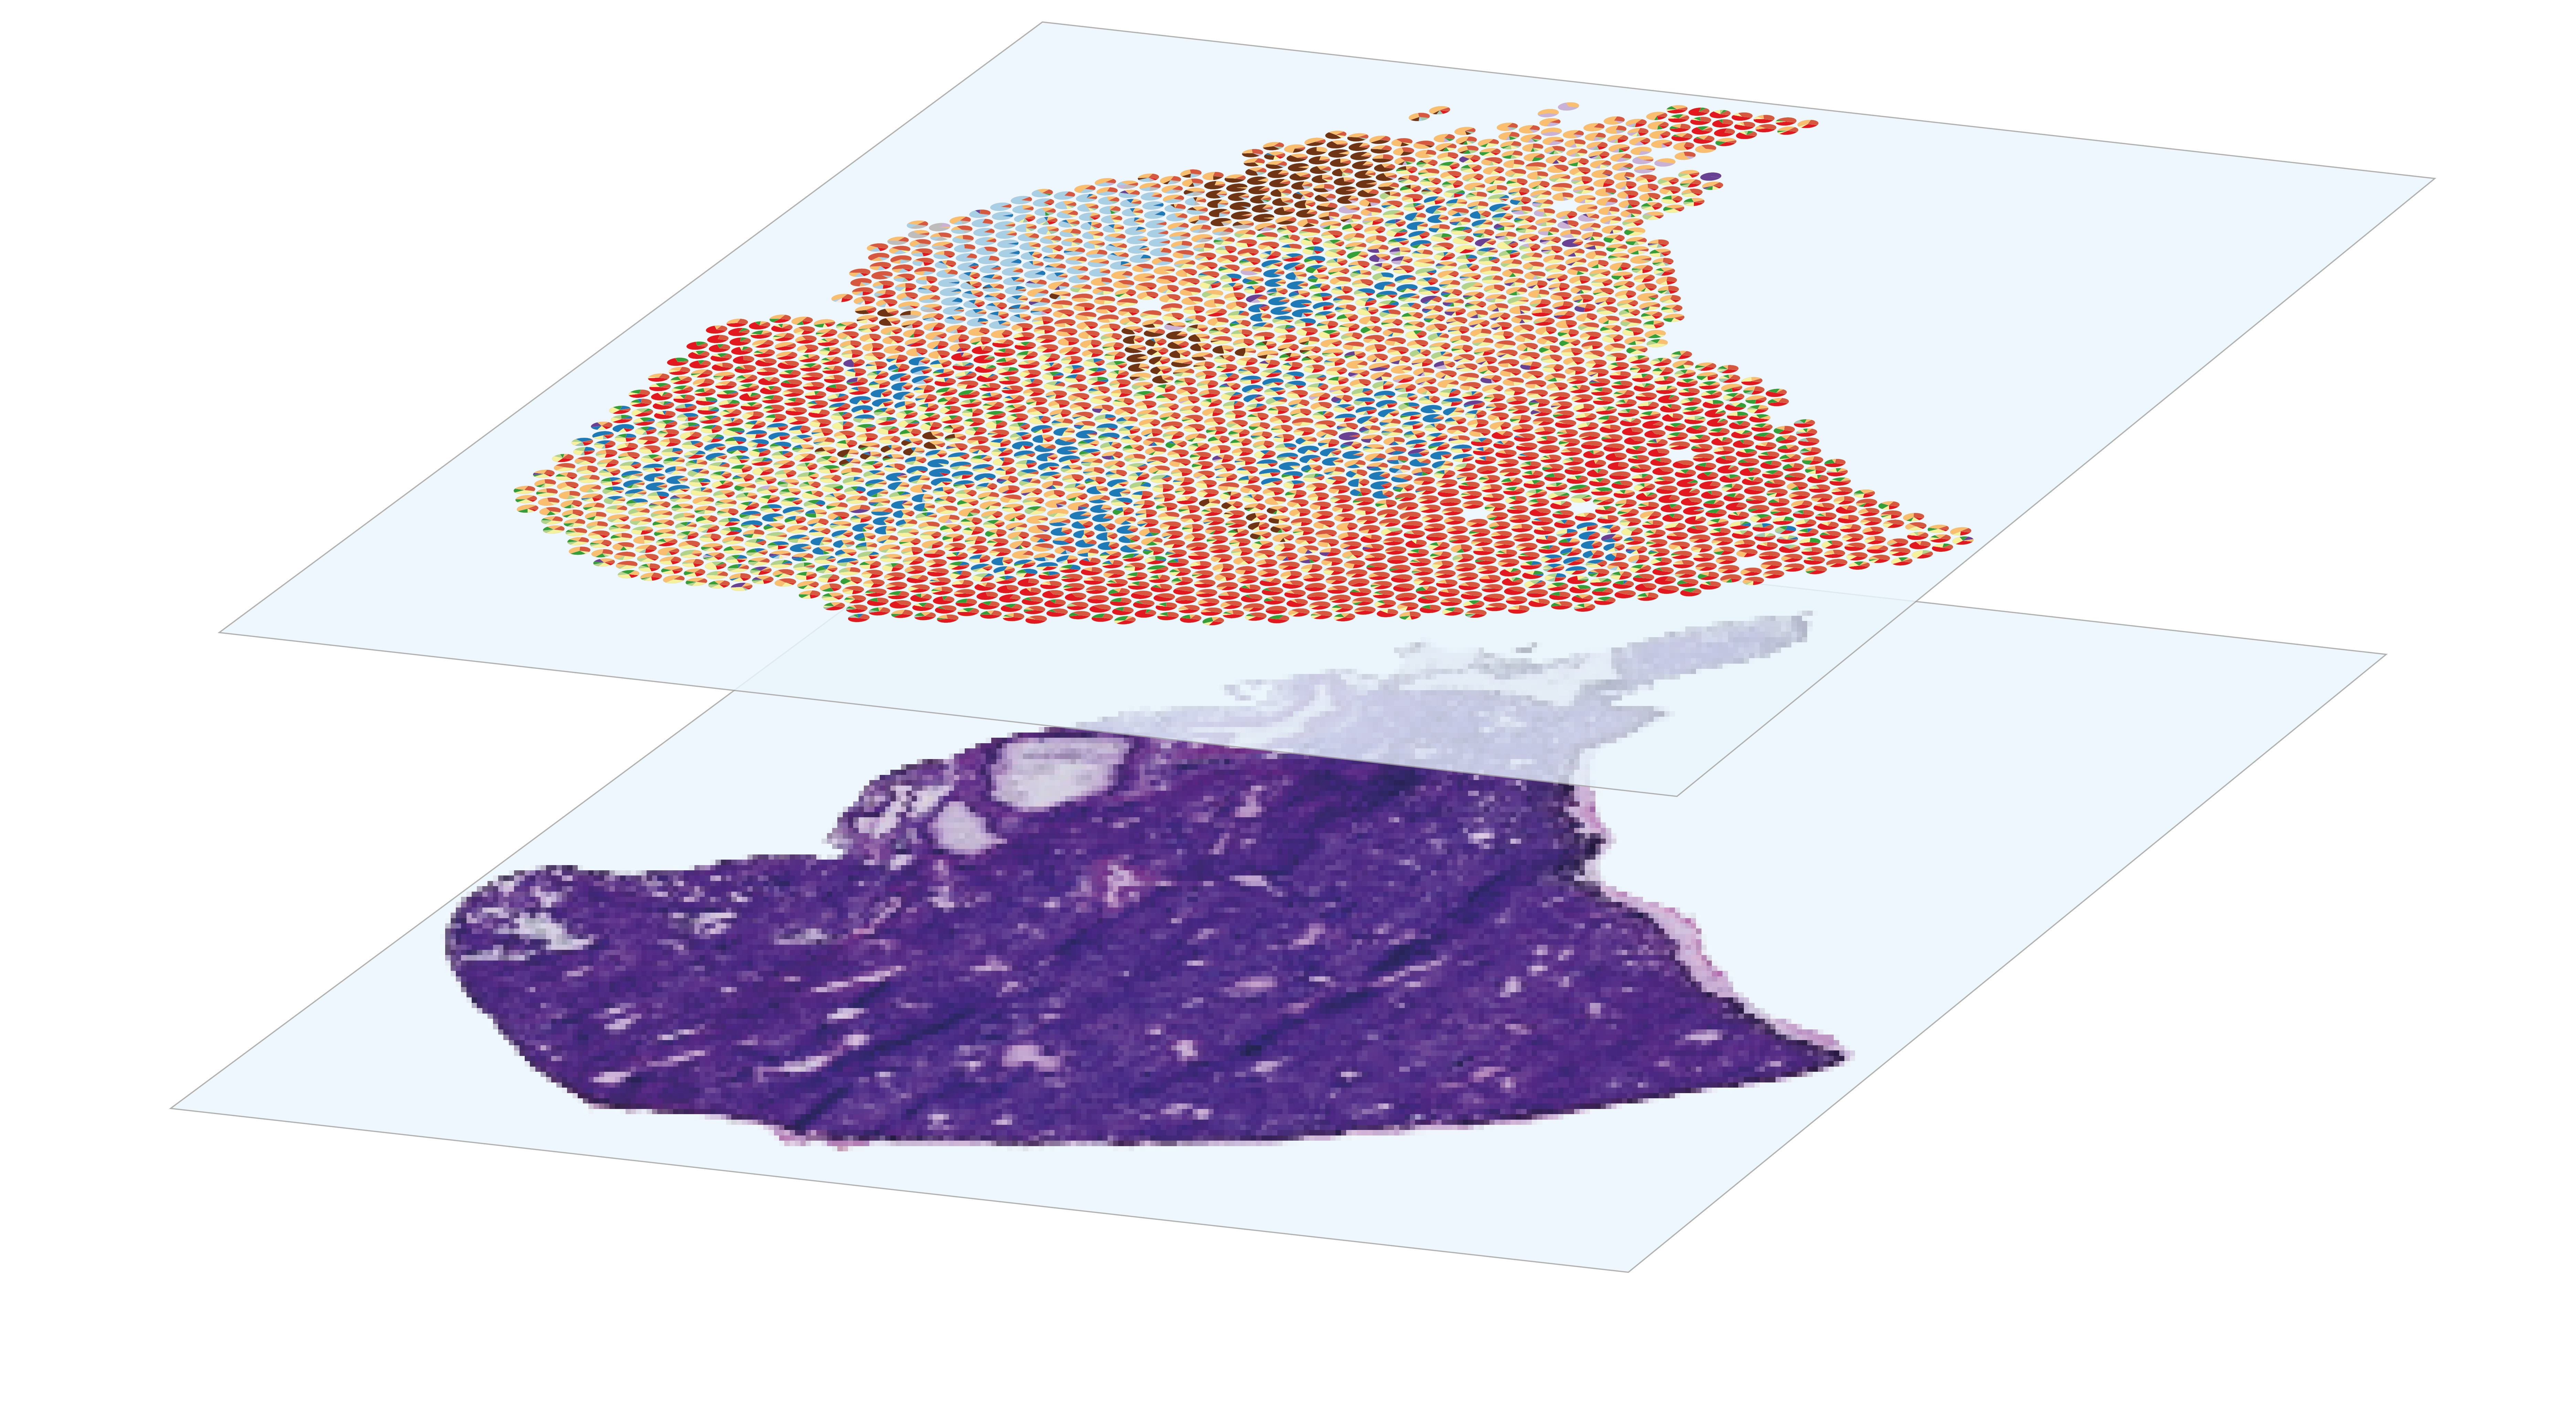
sequencing-based spatial transcriptomics
Analysis of spatial gene expression data generated by sequencing-based systems
https://www.nature.com/articles/s41592-020-01038-7
The analysis of spatial gene expression data generated by the Visium system begins with preprocessing the raw data with space ranger. Briefly, it consists in performing demultiplexing and quality control to filter out low-quality reads, aligning the remaining reads to a reference before counting gene expression from a single capture area. Once the matrix of gene counts per spot has been obtained, the aim is to identify the cell types represented in each spot. Although Visium technology avoids the dissociation step, its resolution is too low to perform single-cell characterization, as each 55µm diameter spot contains several cells. This implies that each spot is a combination of the transcriptome of potentially heterogeneous populations, which can be estimated using deconvolution methods, leveraging or not on a single-cell RNA-seq expression profils reference. After deconvolution, we can compare the distribution of cell types by histological region within the same section, or between sections from different experimental conditions. Combined with the spatial gene expression patterns, spots annotation can be used for Niche analysis, in order to characterize the interactions and relationships between cells and their microenvironment within tissues.
Required assays
| assay | omic | resolution | link |
|---|---|---|---|
| Sequencing-based spatial gene expression | Transcriptomics | Spatial | https://www.nature.com/articles/s41592-024-02325-3 |
Modules list
| Module | Type | Implementation | Description |
|---|---|---|---|
| Ex_situ_ST-space_ranger | Primary analysis | Bash | Space Ranger is the 10X Genomics pipeline designed to analyze spatial gene expression data generated by Visium systems. It begins with processing microscope images of tissue sections to ensure proper alignment and stitching. Next, it demultiplexes and aligns raw sequencing data to a reference genome, generating feature-barcode matrices. The software then performs counting of unique molecular identifiers (UMIs) associated with each gene in each spatial spot. Following this, the software maps the sequencing data to spatial coordinates on the tissue image. It ouputs a repertory notably containing the gene per spot counts matrix, the spatial positions, a web summary of QC metrics, a preliminary default statistical analysis, and a cloupe file for visualization in Loupe Browser. This module is usually performed by the platform that owns the 10x Genomics Visium system, such as UCAGenomiX. |
| Ex_situ_ST-reference_free_celltype_deconvolution | Statistical analysis | R Python Bash | The contribution of cellular populations in each spot can be estimated using deconvolution methodes, which generally rely on a scRNA-seq gene expression profiles reference. However, such reference may not exist due to budgetary, technical, or biological limitations. Moreover, both single cell and spatial gene expression have their own bias limitating the extrapolation of dissociated data on spatial data. For these reasons, it may be useful to use a reference-free deconvolution tool, which infers modules of covarying genes and their contribution to each spot. |
Reference publications
| title | authors | doi |
|---|---|---|
| Mapping spatially resolved transcriptomes in human and mouse pulmonary fibrosis | Lovisa Franzén # 1 2, Martina Olsson Lindvall # 1, Michael Hühn 3, Victoria Ptasinski 1, Laura Setyo 4, Benjamin P Keith 5, Astrid Collin 6, Steven Oag 6, Thomas Volckaert 7, Annika Borde 7, Joakim Lundeberg 2, Julia Lindgren 8, Graham Belfield 8, Sonya Jackson 9, Anna Ollerstam 1, Marianna Stamou 10, Patrik L Ståhl 11, Jorrit J Hornberg 1 | https://pubmed.ncbi.nlm.nih.gov/38951642/ |
| Aging affects reprogramming of murine pulmonary capillary endothelial cells after lung injury | Marin Truchi 1*, Grégoire Savary 2*, Marine Gautier-Isola 1, Hugo Cadis 1, Alberto Baeri 1, Arun Lingampally 3, Célia Scribe 1, Virginie Magnone 1, Cédric Girard-Riboulleau 1, Marie-Jeanne Arguel 1, Clémentine de Schutter 2, Julien Fassy 1, Nihad Boukrout 2, Romain Larrue 2, Nathalie Martin 2, Roger Rezzonico 1, Olivier Pluquet 2, Michael Perrais 2, Véronique Hofman 4, Charles-Hugo Marquette 5, Paul Hofman 4, Andreas Günther 6,7, Nicolas Ricard 8, Pascal Barbry 1, Sylvie Leroy 1,5, Kevin Lebrigand 1, Saverio Bellusci 3, Christelle Cauffiez 2, Georges Vassaux 1, Nicolas Pottier 2* and Bernard Mari 1*# | https://www.biorxiv.org/content/10.1101/2023.07.11.548522v1 |
| The spatial landscape of gene expression isoforms in tissue sections | Kevin Lebrigand 1, Joseph Bergenstråhle 2, Kim Thrane 2, Annelie Mollbrink 2, Konstantinos Meletis 3, Pascal Barbry 1, Rainer Waldmann 1, Joakim Lundeberg 2 | https://pubmed.ncbi.nlm.nih.gov/36928528/ |


