The spatial landscape of gene expression isoforms in tissue sections
Nucleic Acids Res., March 2023
https://pubmed.ncbi.nlm.nih.gov/36928528/Kevin Lebrigand 1, Joseph Bergenstråhle 2, Kim Thrane 2, Annelie Mollbrink 2, Konstantinos Meletis 3, Pascal Barbry 1, Rainer Waldmann 1, Joakim Lundeberg 2
1Université Côte d'Azur, CNRS, Institut de Pharmacologie Moléculaire et Cellulaire, F06560 Sophia Antipolis, France. 2Department of Gene Technology, School of Engineering Sciences in Chemistry, Biotechnology and Health, KTH Royal Institute of Technology, Science for Life Laboratory, Solna, Sweden. 3Department of Neuroscience, Karolinska Institutet, Stockholm, Sweden.
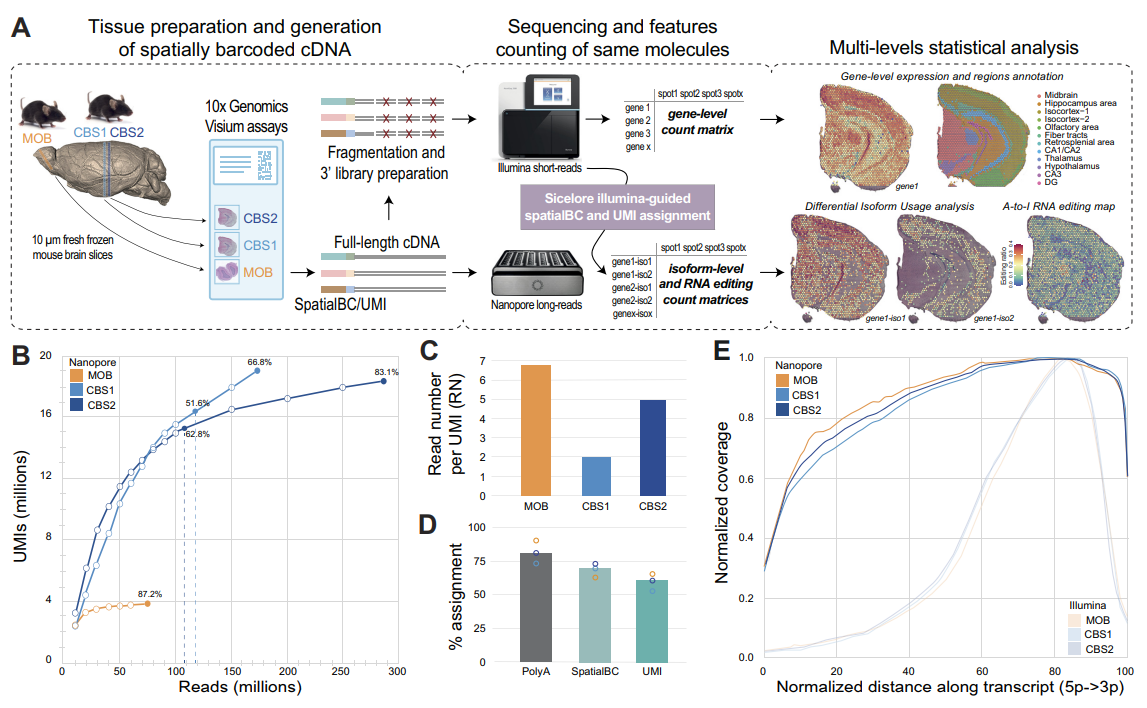
In situ capturing technologies add tissue context to gene expression data, with the potential of providing a greater understanding of complex biological systems. However, splicing variants and full-length sequence heterogeneity cannot be characterized at spatial resolution with current transcriptome profiling methods. To that end, we introduce spatial isoform transcriptomics (SiT), an explorative method for characterizing spatial isoform variation and sequence heterogeneity using long-read sequencing. We show in mouse brain how SiT can be used to profile isoform expression and sequence heterogeneity in different areas of the tissue. SiT reveals regional isoform switching of Plp1 gene between different layers of the olfactory bulb, and the use of external single-cell data allows the nomination of cell types expressing each isoform. Furthermore, SiT identifies differential isoform usage for several major genes implicated in brain function (Snap25, Bin1, Gnas) that are independently validated by in situ sequencing. SiT also provides for the first time an in-depth A-to-I RNA editing map of the adult mouse brain. Data exploration can be performed through an online resource (https://www.isomics.eu), where isoform expression and RNA editing can be visualized in a spatial context.
Used pipelines
sequencing-based spatial transcriptomics
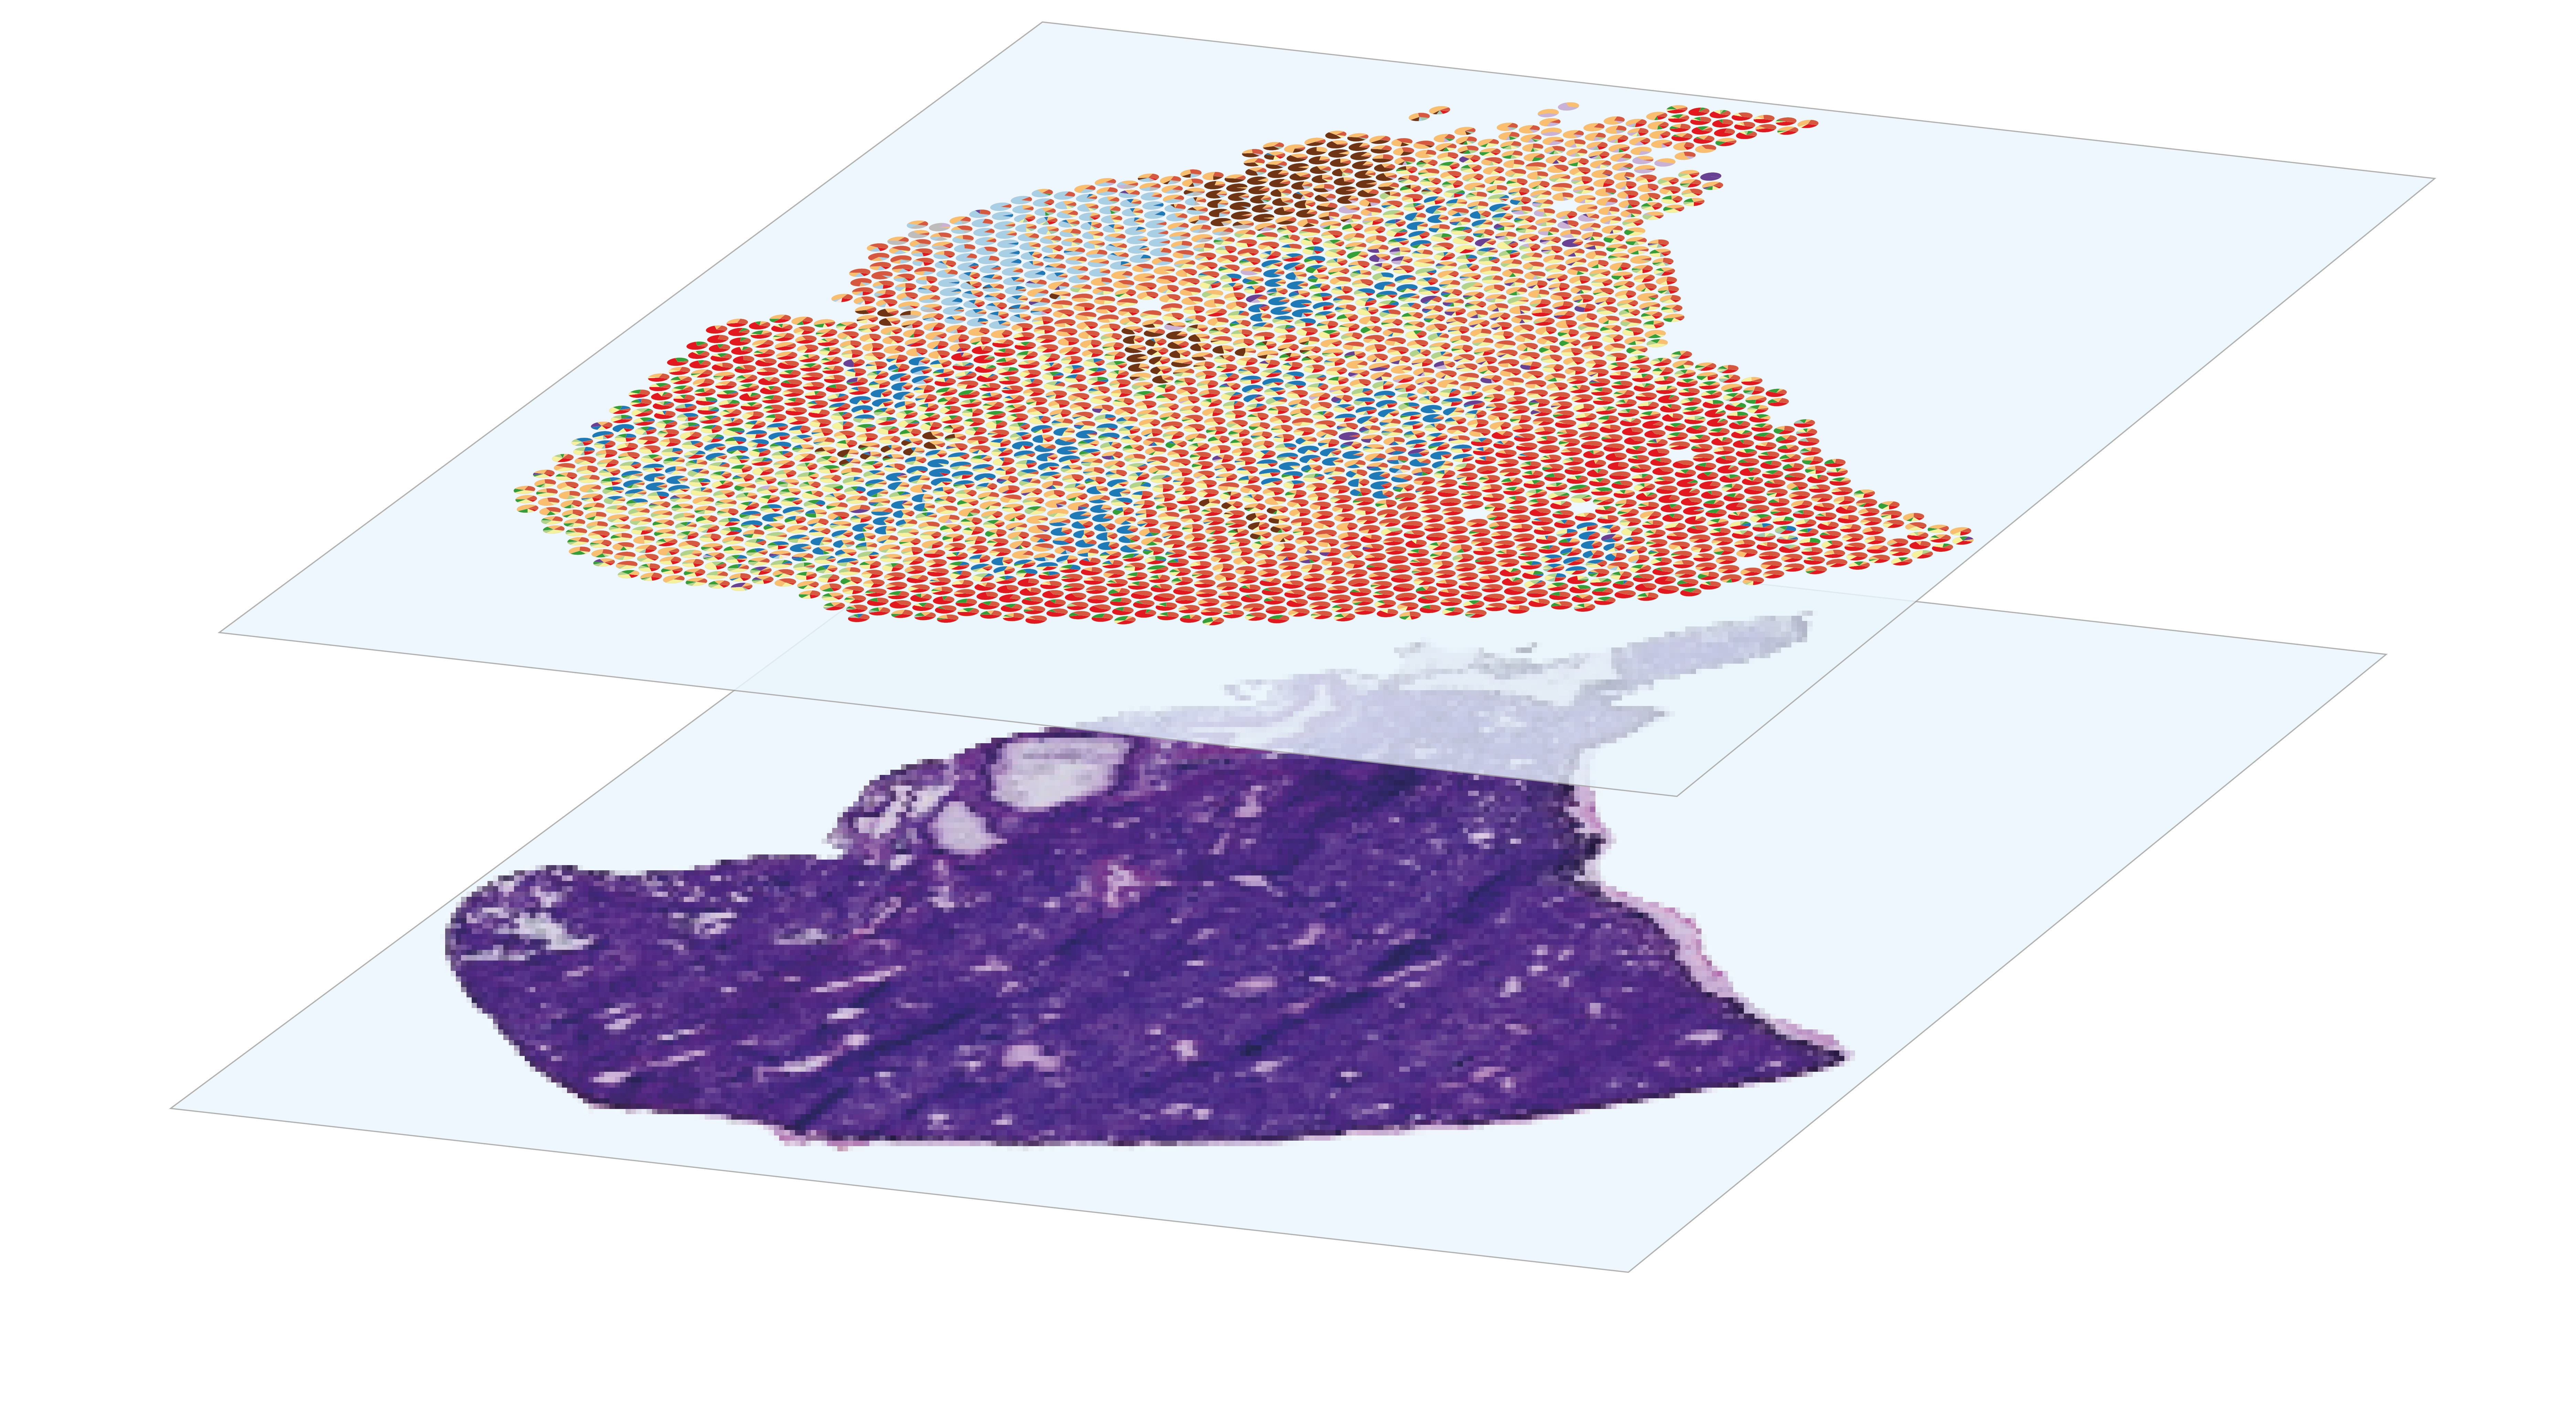
The analysis of spatial gene expression data generated by the Visium system begins with preprocessing the raw data with space ranger. Briefly, it consists in performing demultiplexing and quality control to filter out low-quality reads, aligning the remaining reads to a reference before counting gene expression from a single capture area. Once the matrix of gene counts per spot has been obtained, the aim is to identify the cell types represented in each spot. Although Visium technology avoids the dissociation step, its resolution is too low to perform single-cell characterization, as each 55µm diameter spot contains several cells. This implies that each spot is a combination of the transcriptome of potentially heterogeneous populations, which can be estimated using deconvolution methods, leveraging or not on a single-cell RNA-seq expression profils reference. After deconvolution, we can compare the distribution of cell types by histological region within the same section, or between sections from different experimental conditions. Combined with the spatial gene expression patterns, spots annotation can be used for Niche analysis, in order to characterize the interactions and relationships between cells and their microenvironment within tissues.